
This week, five of the portfolio holdings ranked in the Top Ten.
| Ticker | Account Value |
| ADP | 4,482.39 |
| CMCSA | 3,133.13 |
| HTO | 4,296.63 |
| PEP | 3,215.75 |
| PPG | 3,548.16 |
The lowest amount belongs to CMCSA. However, there exists a sector imbalance whereby only Energy stocks are currently eligible for investment. No Energy stocks made it into the Top Ten. However, each week I screen the full stock universe and get 30 eligible names from which the Top Ten is chosen. If I extend the ranking to 27 while staying within that same eligible group, an Energy stock appears that we do not yet own but still meets all of this week’s criteria.
It is time to add a new position to the Portfolio for the Ages!

Enbridge Inc
Here is the profile from Schwab:
Enbridge Inc., together with its subsidiaries, operates as an energy infrastructure company. The company operates through four segments: Liquids Pipelines, Gas Transmission, Gas Distribution and Storage, and Renewable Power Generation. The Liquids Pipelines segment operates pipelines and related terminals to transport, store, and export various grades of crude oil and other liquid hydrocarbons in Canada and the United States. This segment also provides physical commodity marketing and logistical services, and crude oil marketing services. The Gas Transmission segment invests in natural gas pipelines and gathering and processing facilities in Canada and the United States. The Gas Distribution and Storage segment is involved in natural gas utility operations serving residential, commercial, and industrial customers in Ontario, as well as natural gas distribution activities in Quebec. The Renewable Power Generation segment operates wind, solar, geothermal, waste heat recovery, and transmission assets in North America. The company was formerly known as IPL Energy Inc. and changed its name to Enbridge Inc. in October 1998. Enbridge Inc. was founded in 1949 and is headquartered in Calgary, Canada.
Energy and Canada. Two things you want in your life.
The Details
Note: All amounts are stated in U.S. dollars.
Data as of 2026-09-26:
| Name | Enbridge Inc |
| Ticker | ENB |
| Website | Investor Relations |
| Sector | Energy |
| Dividend Streak | 31 years |
| Last Price | $46.74 |
| Div Amt (quarterly) | $0.6992 |
| Ann Dividend | $2.80 |
| Last Ann Div Inc | 4.5% |
| Dividend Yield | 6.0% |
| Payout Ratio (ttm) | 130.0% |
| Beta (5-yr, mon) | 0.583 |
| P/E Ratio (ttm) | 21.94 |
Reasons to Invest
ENB reached an all-time high of $58.45 on 2026-05-22. It closed at $46.74 yesterday, a 20% drop in 4 months. In fact, it first traded as high as $46.74 on 2013-04-01. What might those thirteen years have looked like if you invested in ENB at that price on April Fool’s Day in 2013? You would have seen a return of 4.4% per annum, without reinvesting dividends.1 That’s not embarrassing, but it does show the importance of a good entry point. And the fact that it is on sale for 20% less than it was four months is at least some assurance of a fair price.
Speaking of fair price – CFRA, GuruFocus, Morningstar, Sure Dividend, and Simply Wall St, have their fair value estimates or 12-month targets falling within a range of $47 to $64.
In addition, Simply Wall St. says there are 21 analysts following ENB and that their 12-month target averages out to $56.
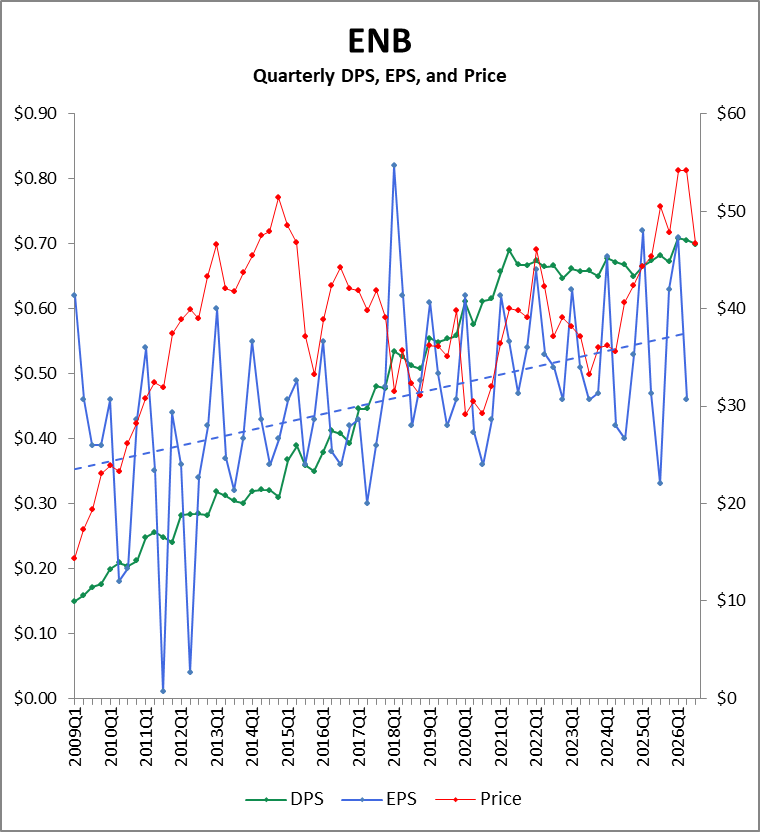
GAAP EPS and even adjusted EPS (shown above) are not the right metric for gauging the performance of midstream pipeline companies. Those numbers are depressed by depreciation, interest expense, and non-cash items. The result is a volatile history of EPS and the implication is that the earnings do not support the dividend. Given that DPS has exceeded EPS for about a decade, one would think ENB would have to cut their dividend yesterday.
The reality is that for companies such as ENB and EPD, distributable cash flow is the correct metric to use for gauging their performance and the safety of the dividend being paid. But distributable cash flow (DCF) is not exactly easy to find outside of their quarterly earnings report – and thus populating a data table with 17 years of DCF just isn’t possible.
For example, 2026Q2 EPS of $0.46 falls short of the $0.70 dividend paid in the quarter. But 2026Q2 DCF of $0.99 has it covered.
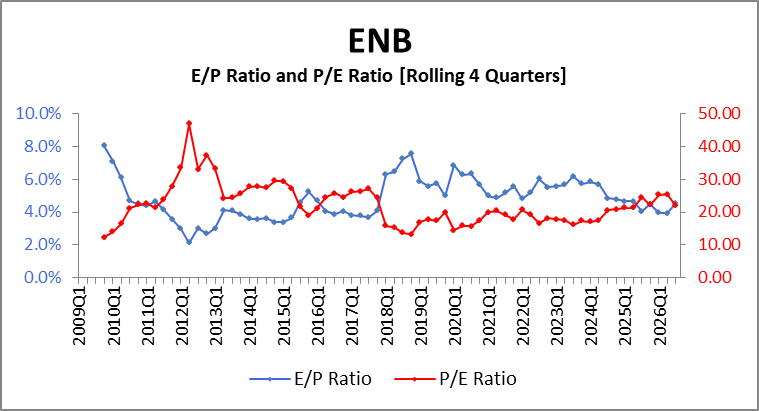
There is nothing remarkable about the graph above except perhaps we could be at an inflection point where the P/E multiple climbs a bit from here. But essentially, the P/E ratio and its inverse, the E/P ratio, are well within historical ranges. This is what it means to have extended from our Top Ten to a Top 27 in order to find an energy stock. It is down 20% but at the same time is most likely fairly valued with modest upside.
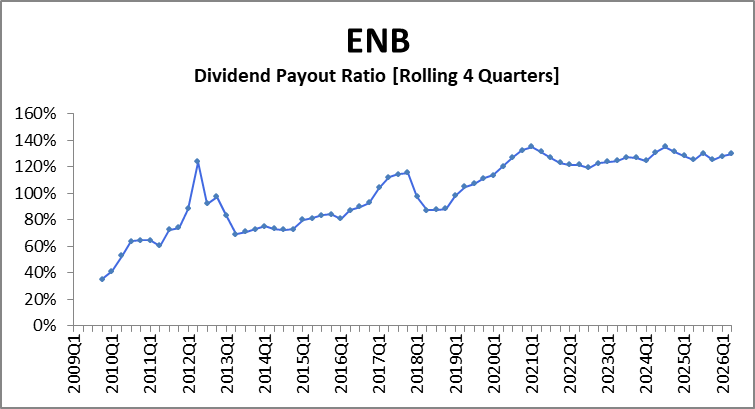
We discussed why the DPR appears to be dangerously high and if it were the right metric on which to assess the safety of their dividend, we would conclude that we should have no expectation of their dividend streak continuing and frankly, we would be wondering just how they’ve been able to increase it for the last decade.
I do not have a good chart at this time for DCF relative to DPS, a metric referred to as coverage ratio in the midstream energy space. Maybe someday. But it is worth mentioning that ENB is largely in the same business as EPD and yet we do not see a high DPR with EPD2. And that is because EPD is extraordinary. They’re the best at what they do. They’re Grand Canyon and ENB, well, they’re Sedona – which is to say, they’re still very impressive, but Grand Canyon should be first on your bucket list.
You might be wondering why we’re not just investing more into EPD at this time instead of adding a position. The short answer is that even though EPD has dropped a bit recently as well, it is believed to be trading about 9% above its estimated fair value and it didn’t make the cut of 30 stocks that met all three criteria in the weekly ranking of the Empire stocks. It just isn’t at a good entry point.
Your next question might be, are ENB and EPD competitors? No, they are not. Their business overlaps considerably but their assets and territories rarely do. So, they are more peers than competitors.
ENB is the stock you might grab instead of EPD when you have a hang-up about acquiring an MLP because of its tax implications.
Royal Dividends has no such issue with MLPs, but we’re looking to expand our Energy exposure at a moment when certain ill‑considered and widely unpopular international actions in and around the Strait of Hormuz are underscoring just how vital energy, of every type, remains to the world.
It’s increasingly difficult to get new pipelines in the ground, and companies that already command a substantial footprint in that space, especially those trading at reasonable entry points, deserve serious consideration.
We’re grabbing 21 shares of ENB on Monday.
- ENB has paid $29.93 in quarterly dividends since 2013-04-01, 4,560 days ago (as of close on 2026-09-25). Therefore, the annualized return is calculated as ((29.93+46.74)/46.74)^(365/4,560)-1 = .0404 or 4.04%. I have discovered a truly remarkable calculation of what this return with dividends would have been, which this footnote is too small to contain. I can tell you the result was approximately 5.8%. ↩︎
- The acronyms and tickers are just off the charts, people! ↩︎