
Upon the execution of your order to sell a covered call on SGI (see the previous post), you should have additional uninvested income of $523.90 to go with your regular $250+ per week installment.
This week, six of the portfolio holdings ranked in the Top Ten.
| Ticker | Account Value |
| ADP | 4,610.74 |
| CMCSA | 2,478.66 |
| HTO | 4,324.23 |
| PEP | 3,243.75 |
| PPG | 3,449.16 |
| SCL | 4,207.84 |
The lowest amount belongs to CMCSA. With the additional funds this week, we will acquire 34 shares of CMCSA on Monday morning. Below, is the purchase history and average cost calculation.
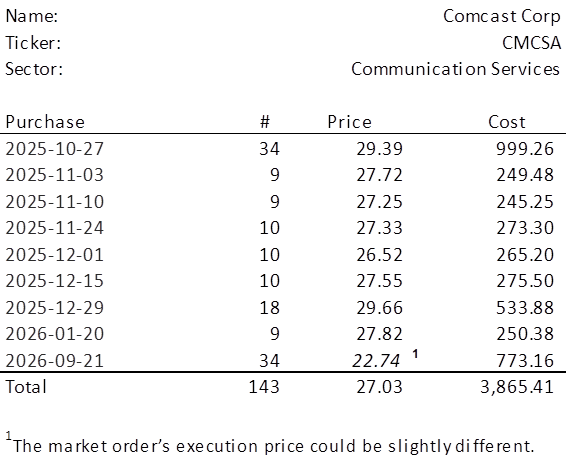
It has been eight months since we last added to our CMCSA position. Let us take a look at the recent earnings performance by placing it into the broader context of the last 17+ years.
Observations
Stock Price
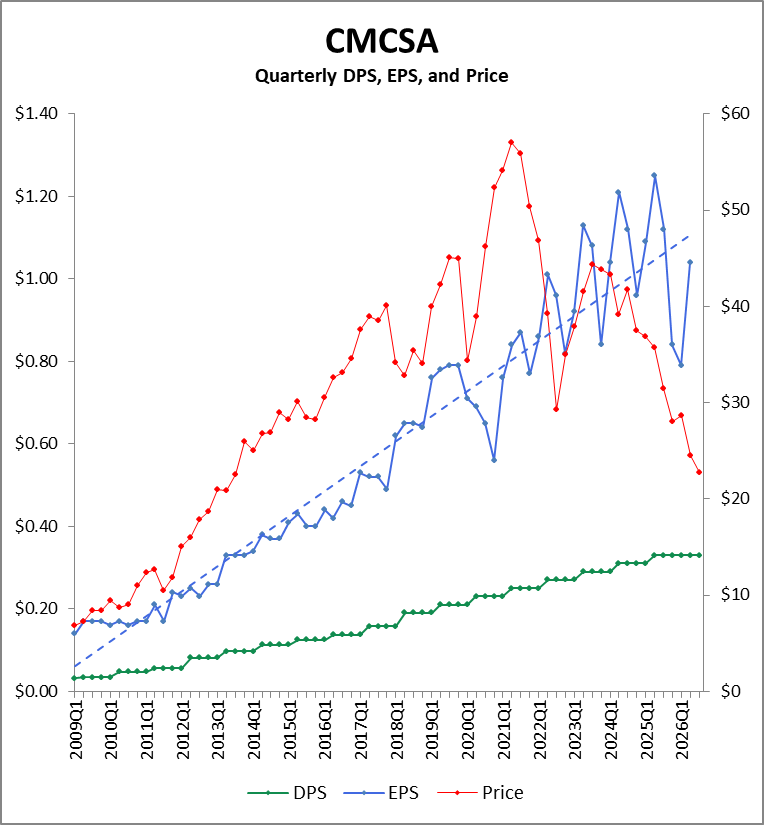
After reaching an all-time high of $57.92 in September of 2021, CMCSA became poison. CMCSA has gone through a long and volatile decline, fell through a support ‘range’, and now finds itself down 60% from those all-time highs. Bear in mind, it did spinoff a chunk of it’s business now publicly traded as Versant Media Group, Inc. [VSNT] but that would only explain perhaps 6% of that fall.
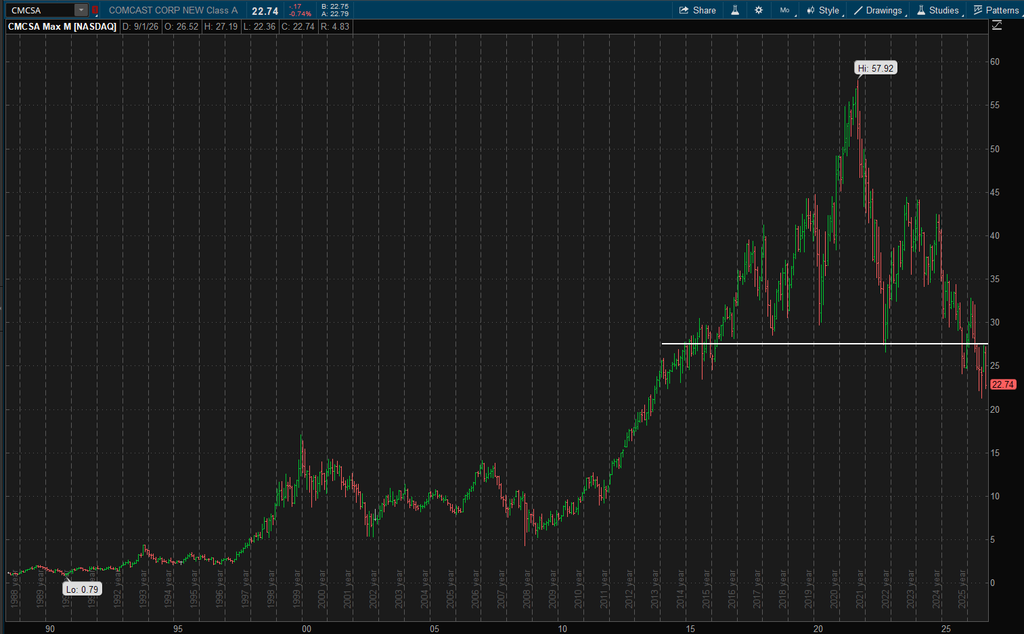
I have depicted the support at $27.50. It is also the level at which our covered call would be assigned. I chose that strike specifically because it seemed like CMCSA might struggle to get back above it. And now that CMCSA has fallen more than 15% over the last two weeks, it would appear that $27.50 is now out of reach for the time being. Part of that drop is most assuredly related to the CFO’s comments that broadband subscriber losses will not improve this quarter. The rest is likely just a hated company falling with the rest of the market.
Earnings
Magnitude/Trend
Until very recently, quarterly earnings have been in a strong, long-term, positive trend. This is easily seen in the blue dotted line in the chart above. However, it is not easy to strip out the impact VSNT would have had on historical earnings levels. And so, the dropoff is certainly impacted by the spinoff. Historical earnings will become even less relevant when the spinoff of NBCUniversal + Sky is complete.
We do know that 2026Q1 EPS came in at $0.79 and 2026Q2 EPS at $1.04. With the VSNT spinoff completed at the beginning of the year, these earnings exclude any contribution from the divested business and represent the ongoing operations alone. The equivalent numbers from the prior year Q1 and Q2 are $1.09 and $1.25. Those numbers include the VSNT business, and they were each record EPS levels for their respective quarters. Thus, we have 2026H1 EPS of $1.83 vs a loaded 2025H1 EPS of $2.34.
Whereas the earnings have fallen 22%, the stock price has fallen 36% from the half-way point of 2025. Think oversold.
Seasonality
Typically, the quarterly distribution of annual earnings breaks down as follows: 23.9% in Q1, 26.3% in Q2, 25.3% in Q3, and 24.4% in Q4. The variation around these percentages is minimal. The difference between the halves of the calendar year is equally unremarkable with the first half typically coming in at 50.2% and the second half at 49.8%. Essentially, there is no seasonality to CMCSA’s earnings.
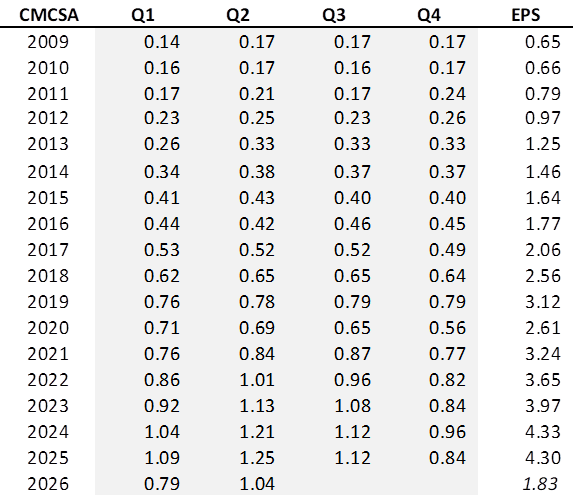
With 2026H1 EPS of $1.83, it wouldn’t be wrong to expect earnings for the full year to come in around $3.66, right around 2022 levels. Now, 2022 closed out with a price of $34.97. Could we get back to that level?
Dividends
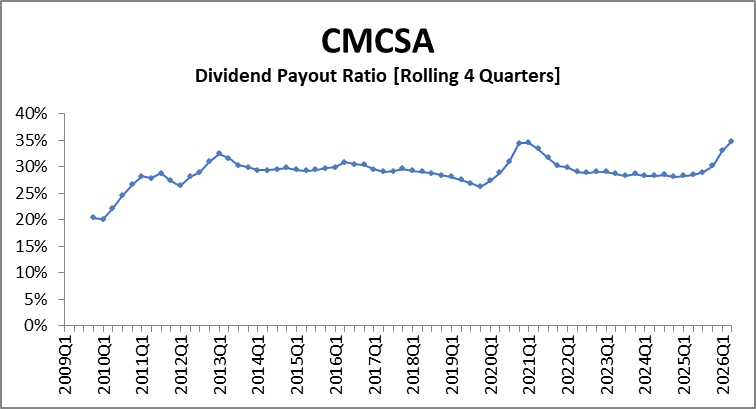
CMCSA has an 18-year dividend streak in the Communication Services sector which is apparently like having 60 years as a Utility. The DPR is at the very high end of the historical range and yet still extraordinarily safe. All that being said, they’ve paid the same $0.33 quarterly dividend six straight quarters. Now the streak wouldn’t end unless they go all of 2027 without raising it. The reality is that they are likely to reduce the dividend when they spinoff NBCUniversal and Sky and an assessment will have to be done as to whether the dividend that follows represents a valid continuation of the streak.
The 5.8% yield is the highest level seen over the past 17 years, and yet easily supported by earnings.
Thoughts on Investment
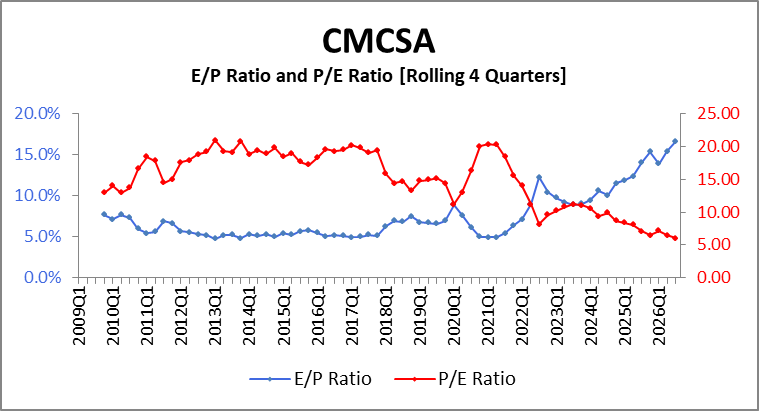
The trailing 12-month P/E ratio is currently 6.00 (!), lower than the average for CMCSA of 15.17 over the period above. Let’s be honest, if today’s price is truly the present value of future dividends, a reflection of future earnings, then the market is unusually prescient in the case of this one stock.
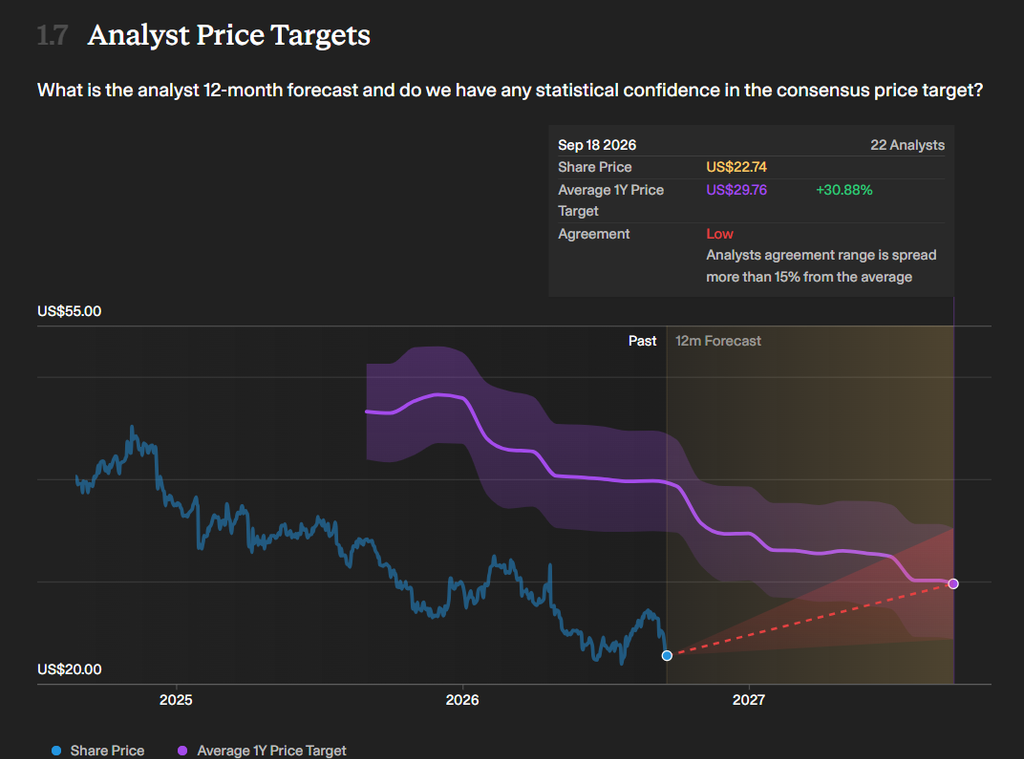
CFRA, GuruFocus, Morningstar, Sure Dividend, and Simply Wall St, have their fair value estimates or 12-month targets falling within a range of $25 to $37.
Simply Wall St. says there are 22 analysts following CMCSA and that their 12-month target averages out to $29.76. However, they have a display that shows the range around that average estimate and also how that range and average have tracked over the recent past as well. It makes for a great visual:
As I said, I think CMCSA is oversold and Royal Dividends is going to take advantage by adding 34 shares on Monday.