
This will count as the fifth of nine scheduled ‘off’ weeks—an intentional pause to restore our $250+ weekly pace after using significant outside capital to triple our LEG position. However, we do have $252.00 in uninvested cash available to deploy.
This week, seven of the portfolio holdings ranked in the Top Ten.
| Ticker | Account Value |
| ADP | 3,407.99 |
| BDX | 3,012.26 |
| HTO | 4,005.45 |
| PEP | 3,626.41 |
| PPG | 3,790.05 |
| QCOM | 3,405.00 |
| SCL | 3,496.56 |
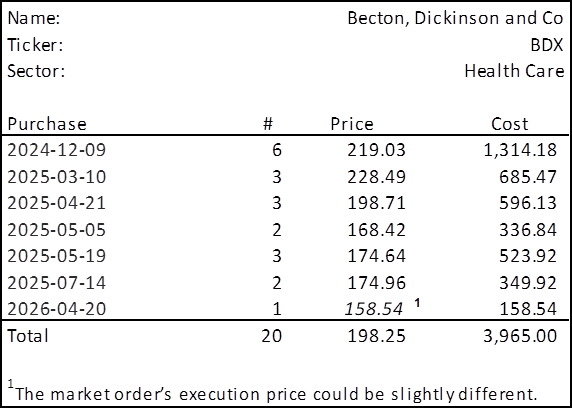
There is a position imbalance whereby LEG is no longer eligible for additional investment. No matter, we have no interest in purchasing any more stock of LEG. The lowest amount belongs to BDX which last traded at $158.54. I will acquire 1 share of BDX on Monday morning. Below, is the purchase history and average cost calculation.
Before taking a closer look at BDX, I would like to point out that our position in LEG has finally become profitable (+$29.74) as of market close 2026-04-17! LEG is up 28.4% since 2026-04-02 and most of that is due to the announcement that it will be acquired by Somnigroup International [SGI] – see my post on 2026-04-13. Though the position is finally in the green, we cannot yet close the position; call options that were sold on LEG lock us in until 2026-09-18 (unless shares are called away earlier). The share price can still rise another $0.47 before our profit is capped so, we’re okay waiting it out.
It has been nine months since we last added to our position in BDX. Let’s place their recent performance into the context of the last 17+ years.
Observations
Stock Price
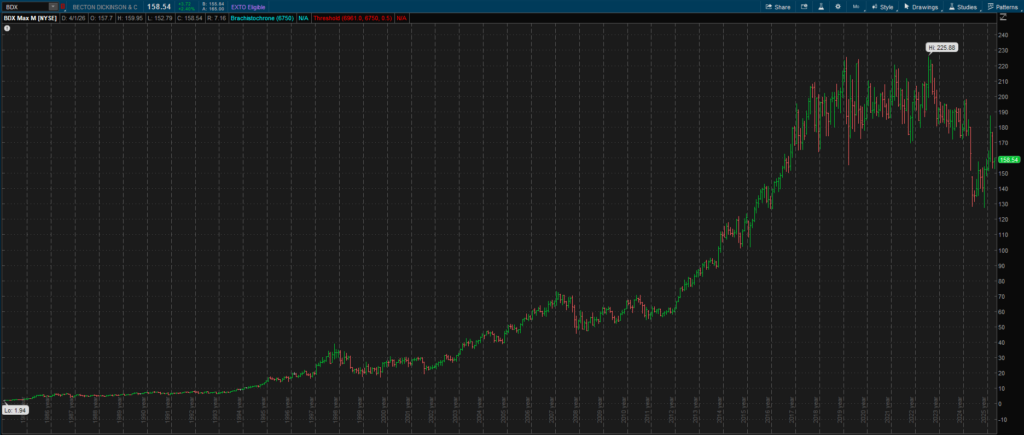
BDX reached an all-time high of $225.881 on 2023-07-24 and fell 43.5% to a ridiculous $127.59 on 2025-11-05. Since then, it has bounced back some 24.3% to $158.54, but it still has another 42.5% to get back to its all-time high. And I know what you’re thinking: how can it have dropped 43.5%, risen 24.3% off the bottom and still need another 42-ish% to get back to square? How can that bounce of 24.3% be essentially worthless? Math. Learn to love it.2
Earnings
Magnitude/Trend
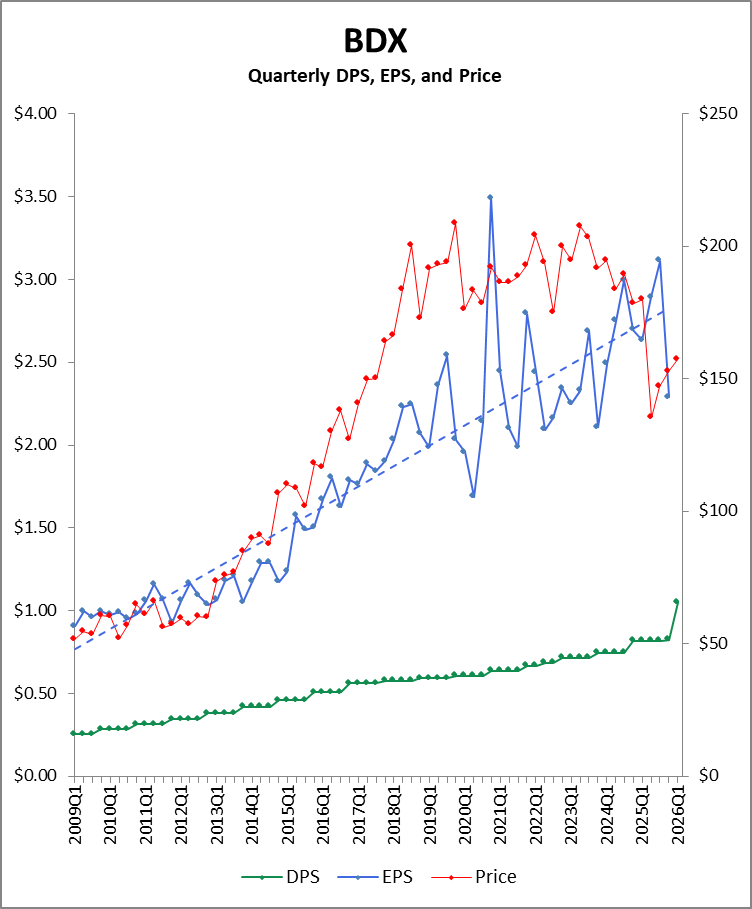
Clearly, the quarterly earnings are in a strong, long-term, positive trend. The blue dotted line in the chart above does a good job of delineating the overall earnings trend.
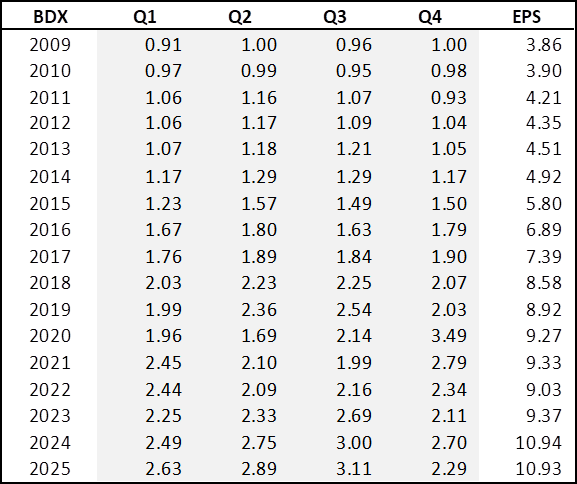
Had the 2025Q4 EPS of $2.293 been $0.02 higher, CY2025 EPS would have been the all-time highest.
Seasonality
Typically, the quarterly distribution of annual earnings breaks down as follows: 23.9% in Q1, 25.3% in Q2, 25.5% in Q3, and 25.3% in Q4. The variation around these percentages is minimal. The difference between the halves of the calendar year is equally negligible with the first half typically coming in at 49.1% and the second half at 50.9%.
Dividends
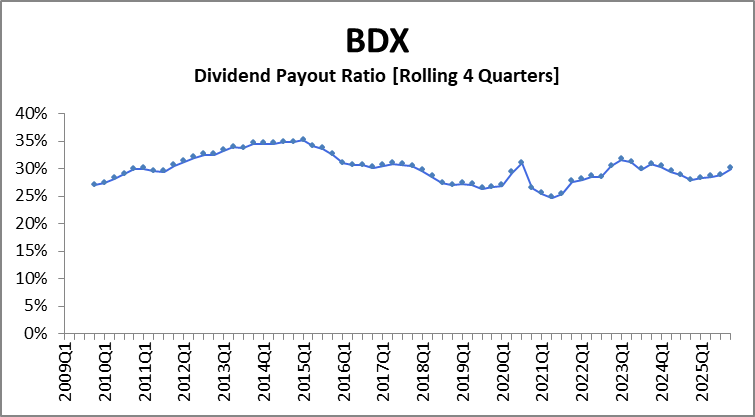
BDX has a 54-year dividend increase streak, making them a Dividend King. Their dividend payout ratio is safe and hovers around 30%. In fact, with BDX recently spinning off over a fifth of their business, they could have been expected to reduce their quarterly dividend by a similar factor (and then we’d all be scrambling to see if the reduced dividend was reduced to an extent that the dividend authorities might consider an abdication of the throne), but they kept it the same at $1.054.
Thoughts on Investment
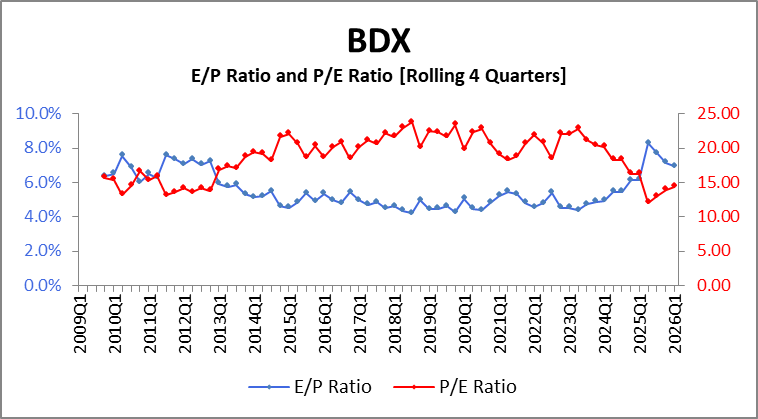
The trailing 12-month P/E ratio is currently 14.5, lower than the average for BDX of 18.8 over the period above.
BDX has revealed their EPS guidance for fiscal year 2026 (which is already one quarter complete) to be in the range of $12.35 to $12.65. Their own estimate of FY2025 EPS without the Biosciences and Diagnostics Solutions business is $11.805. That’s a 5.9% increase at the guidance midpoint.
Further, CFRA, Sure Dividend, Morningstar, GuruFocus, and Simply Wall St., all place their fair value or 12-month target higher than where it is currently trading, ranging from $181 to $238.
Let’s take a nibble on BDX right now and if it is still undervalued in a month, we’ll take a bigger bite.
- This record high does not appear in the chart above, because the graph is built on quarterly closing prices. Another interesting factoid is that the prices seen in my graph and the ThinkorSwim screenshot have been altered from what one might remember. Before 2026-02-09, one might have recalled that BDX’s all-time high was $287.32. How can this be? It turns out that on 2026-02-09, BDX completed its spinoff/sale of their Biosciences & Diagnostic Solutions business to Water Corporation [WAT]. BDX shareholders received a payment of 0.135 shares of WAT for every share of BDX they held.
Unfortunately, a company cannot sell a chunk of its business and see their shares hold on to 100% of their pre-spinoff value. The BDX share price was adjusted as though it did a 1,272 to 1,000 stock split. How was this ratio arrived at? Ugh, I knew you would ask. The value of the business sold is imputed using the following:
BDX closing price on 2026-02-06 (as initially reported): 210.02
WAT opening price on 2026-02-09: 332.29
0.135 WAT = 1 BDX
1/[1 – (0.135 x 332.29) / 210.02] = 1.2716 or 1272/1000
Intuitively, this calculation should make sense: the value of the spinoff was estimated to be .135 x 332.29 = 44.86 which was about 44.86/210.02 or 21.4% of the value of BDX prior to spinoff, meaning BDX is approximately 78.6% of their previous size. If historical prices of BDX are to be comparable to their business going forward, one should divide them by approximately 1/0.786 or 1.272.
And so now one sees BDX as having closed at 165.11 on 2026-02-06 and all other prices before that have been reduced by dividing by (1272/1000). The adjustment is also done to historical dividends as well. Whenever you see a quarterly dividend like 0.0632578 in the deep past of a stock, it is unlikely they actually declared and paid such a wacky dividend per share, but rather a more sane dividend like 0.12 or even 0.1225 was paid at the time. The stock has likely had pseudo stock-split adjustments made to its historical data. I have even adjusted the EPS numbers reported prior to 2026-02-09 in the same manner mostly so that historical PE ratios and earnings yields have meaning.
↩︎ - Sadly, when a stock price drops 10%, it must climb 11.1% to get back to square: [1/(1-.10)]-1 = .111… But if a stock drops 43.5% we need a [1/(1-.435)]-1 = .77 or 77% increase before we feel whole again.
↩︎ - This number was reported as $2.91 but I have adjusted it by the same factor used to adjust historical prices and dividends (see footnote #1). I went with the parenthetical just now, because believe it or not, a footnote within a footnote produces a superscripted asterisk with no corresponding other asterisk. Believe it.
↩︎ - Dividends are represented by the green line in the first graph above and the final quarter is markedly higher than the previous quarter. This is because the previous $1.05 quarterly dividend has been, you guessed it, adjusted by dividing by 1.272 as discussed in footnote #1. This means that while the quarterly dividend remained unchanged, it has been, in effect, raised 27.2%! Speaking of paradoxes, given I have now referred to the same factor in three footnotes of considerable volume, I probably should have created a section for it in the text of the post itself instead of flirting with the unheard-of result of having footnote content exceed post content. Frankly, if the charts and graphs were to be removed, I cannot be sure I haven’t already crossed into this uncharted (pun!), footnote-dominant realm already.
↩︎ - The fiscal year runs from October 1st through September 30th. My adjusted EPS number for FY2025 as shown in the earnings chart is $11.34. This is markedly different than their own estimate and that is the primary disadvantage of trying to adjust historical numbers with a factor (see foot…I can’t say it) based on the whims of the market and the opening value of a stock on a given day. But this is the life of an investor making such massive investments as buying 1 share of BDX. ↩︎