
This week, seven of the portfolio holdings ranked in the Top Ten.
| Ticker | Account Value |
| BDX | 3,312.40 |
| CMCSA | 2,611.64 |
| HTO | 4,231.77 |
| MZTI | 2,351.14 |
| PEP | 3,209.88 |
| PPG | 3,647.16 |
| QCOM | 3,690.25 |
The lowest amount belongs to MZTI. However, there exists a sector imbalance whereby only Energy, Information Technology, and Real Estate are currently eligible for investment. No Real Estate or Energy stocks made it into the Top Ten. However, there was one Information Technology stock that came in at #10 and as it so happens it is a current holding. QCOM last traded at $147.61, and I will acquire 2 shares on Monday morning. Below, is the purchase history and average cost calculation.
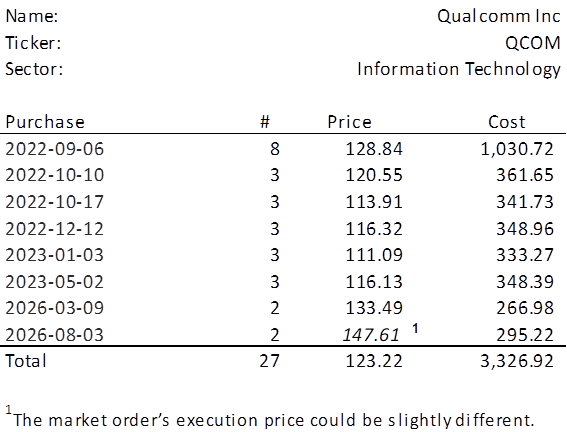
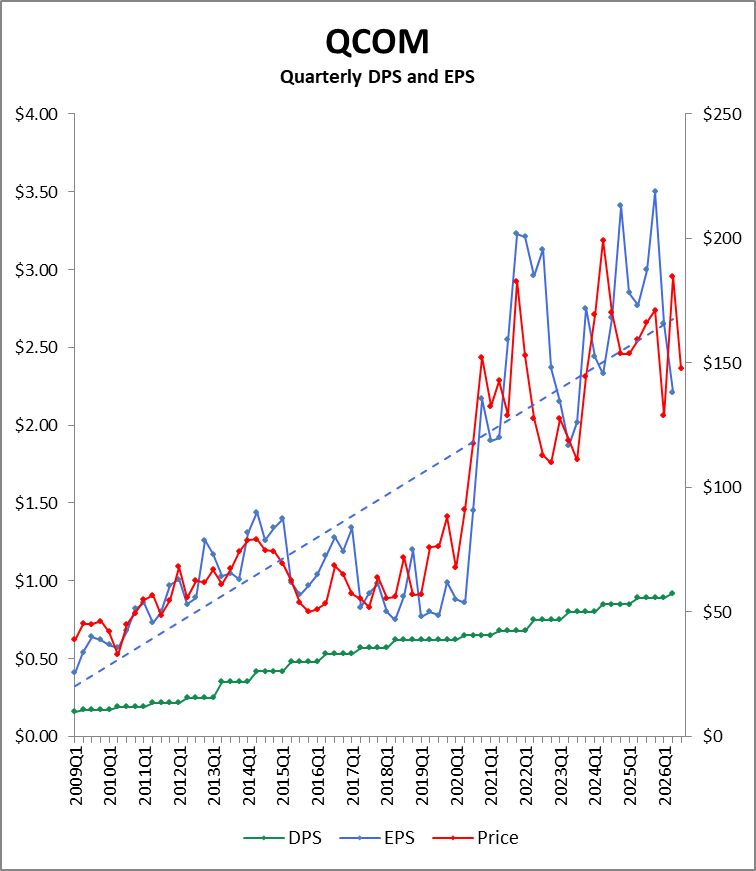
It has been nearly five months since we last added to our position in QCOM. It has been in the Top Ten on a few occasions since then, it’s just that there has always been at least one position in greater need. Let’s place the recent performance into the context of the last 17+ years.
Observations
Stock Price
QCOM reached an all-time high of $259.921 on 2026-05-29 and has fallen all the way down to $147.61 as of Friday’s close. That’s a wonderful little 43% slide in two months. Obviously QCOM’s days are numbered.
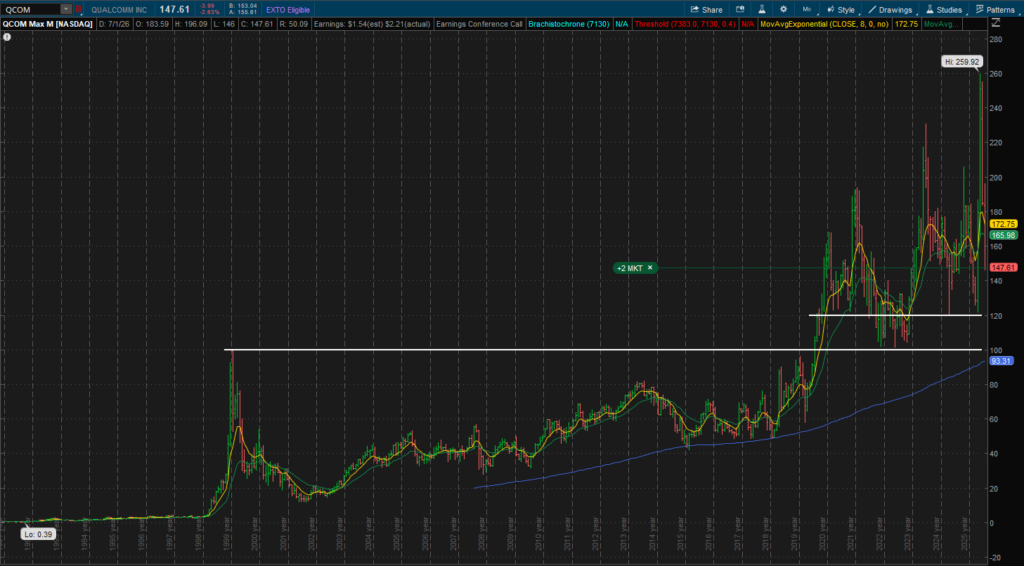
I kid. The daily chart from Charles Schwab’s thinkorswim trading platform draws attention to (1) the $100 support level touched in 2022 and 2023, first established at the start of 2000 as a stalagmite, (2) a new $120 support level that may have been established more recently, and (3) the extreme price volatility over the last few years. In fact, when QCOM was first added to the Portfolio for the Ages, it possessed a 5-year, monthly Beta of 1.24. Now, that same Beta calculation is 1.59.
One will note that in the quarterly chart above, the stock price tracks quarterly EPS fairly well (albeit on different scales) and that the price volatility reflects the earnings volatility.
Earnings
Magnitude/Trend
Clearly, the quarterly earnings are in a strong, long-term, positive trend. The blue dotted line in the chart above actually does a poor job of delineating the overall earnings trend, largely due to a five-year span of flat to declining earnings in the middle of the chart. However, those days are behind QCOM. EPS exploded in 2022Q3 and, with significant volatility, the EPS has been very strong.
QCOM has a fiscal year that ends on September 30th. FY2022 EPS of $12.53 stands as the all-time high. However, CY2025 EPS of $12.12 is the record for a calendar year and is more easily seen when we take a look at seasonality below, which at Royal Dividends is always on a calendar year basis. Put simply, even if next quarter lands at the midpoint of guidance, FY2026 EPS would be about $10.51—a 12.6% decline from the prior year. And with one quarter still remaining in CY2026 at that point, it’s very likely that the records EPS of CY2025 will continue to hold.
Seasonality
Typically, the quarterly distribution of annual earnings breaks down as follows: 24.2% in Q1, 22.3% in Q2, 24.8% in Q3, and 28.7% in Q4. The variation around these percentages is minimal. The difference between the halves of the calendar year is a bit more pronounced with the first half typically coming in at 46.5% and the second half at 53.5%.
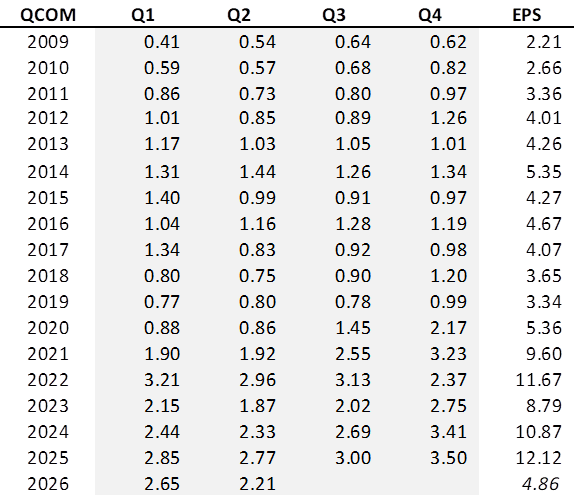
QCOM only provides guidance for the next quarter as it represents the end of their fiscal year, so some liberties have to be taken in order to visualize how this calendar year might end. With 2026H1 EPS of $4.86, and with the assumption that 2026Q3 comes in at the midpoint of guidance we have $7.01 with one calendar quarter remaining. The average multiplier to go from YTD EPS through Q3 to the full CY EPS is 1.41. That would put us at CY2026 EPS of $9.88. So, whereas FY2026 may end up down perhaps 12.6%, CY2026 might be down a bit more, but I suspect it won’t be a 43% fall off like the stock price just saw.
Or things may change. Maybe the economy picks up. Maybe the wars overseas will dissipate. Or maybe WWIII is well underway or a solar flare renders smartphones, tablets, laptops, etc. useless. Forecasting is a fun exercise, but it is futile. And if you think the collective stock market gets it right, bless your heart.
Dividends
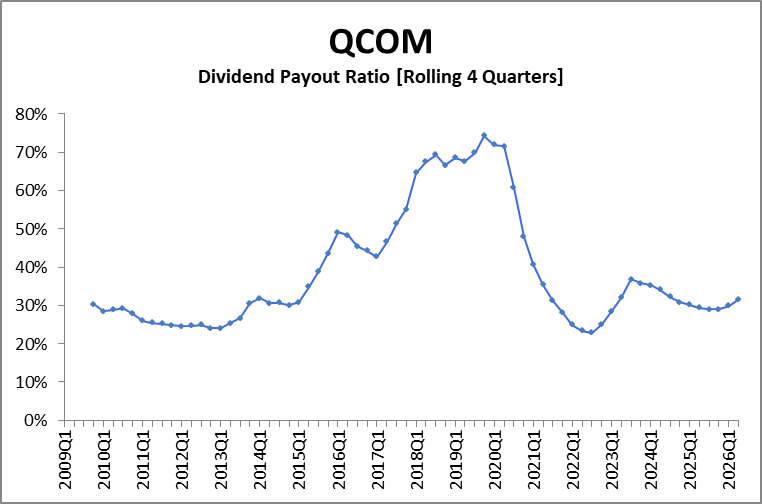
The Information Technology sector has no Dividend Kings. However, it is highly likely that in less than a year, QCOM will be a Dividend Aristocrat with a 25-year dividend increase streak. The company’s dividend payout ratio is hovering around 30% and the dividend yield is a respectable 2.5%.
Thoughts on Investment
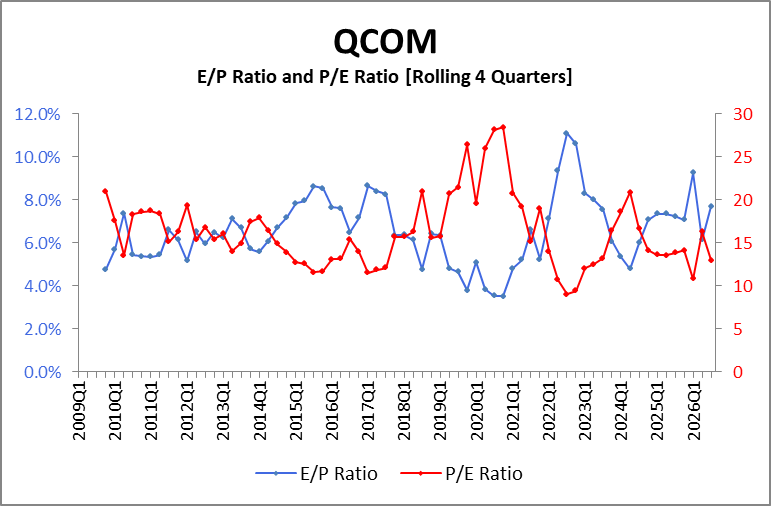
The trailing 12-month P/E ratio is currently 12.99, lower than the average for QCOM of 16.19 over the period above.
It is unlikely either FY2026 or CY2026 will set a record for EPS. But there is nothing to suggest QCOM won’t keep raising its dividend annually.
Further, CFRA, Sure Dividend, Morningstar, GuruFocus, and Simply Wall St, all place their fair value or 12-month target value higher than where it is currently trading, ranging from $170 to $300. So, let’s take some comfort in the collective analysis and evaluation by people who are right just as often as they are wrong and grab some shares without questioning their expertise. But really, QCOM is returning 8% annually for us, despite paying out a relatively small dividend. Royal Dividends says it is a great time to add to the QCOM position.
- This high is not seen in the very first chart presented because that chart only captures the price of each quarter’s close. ↩︎