
Along with the usual $250+ weekly contribution, we have $287.68 in uninvested cash available to deploy.
This week, eight of the portfolio holdings ranked in the Top Ten.
| Ticker | Account Value |
| ABT | 1,509.34 |
| ADP | 4,612.44 |
| BDX | 3,537.20 |
| CMCSA | 2,764.24 |
| HTO | 4,323.54 |
| MZTI | 2,496.56 |
| PEP | 3,197.46 |
| PPG | 3,950.76 |
The lowest amount belongs to ABT. However, there exists a sector imbalance whereby only Energy and Real Estate are currently eligible for investment. No Real Estate or Energy stocks made it into the Top Ten. However, if I extend to a Top 17, a REIT creeps into the mix, and it isn’t one of the three REITs we currently own.
It is time to add a new position to the Portfolio for the Ages!

Realty Income Corp
Here is the profile from Schwab:
Realty Income Corporation, an S&P 500 company, is real estate partner to the world’s leading companies. They serve their clients as a full-service real estate capital provider. As of March 31, 2026, they have a portfolio of over 15,500 properties in all 50 U.S. states, the U.K., and eight other countries in Europe. They are known as (The Monthly Dividend Company) and have a mission to invest in people and places to deliver dependable monthly dividends that increase over time. Since founding, they have declared 673 consecutive monthly dividends and are a member of the S&P 500 Dividend Aristocrats index for having increased dividend for over 31 consecutive years. The firm was founded and incorporated in 1969 in Maryland and is based in San Diego, California.
You read it. They are literally known as The Monthly Dividend Company.
The Details
Data as of 2026-08-08:
| Name | Realty Income Corp |
| Ticker | O |
| Website | Investor Relations |
| Sector | Real Estate |
| Dividend Streak | 31 years |
| Last Price | $62.51 |
| Div Amt (monthly) | $0.271 |
| Ann Dividend | $3.25 |
| Last Ann Div Inc | 1.5% |
| Dividend Yield | 5.2% |
| Payout Ratio (ttm) | 74.2% |
| Beta (5-yr, mon) | 0.71 |
| P/E Ratio (ttm) | 14.27 |
Reasons to Invest
O reached an all-time high of $82.29 on 2020-02-20. Less than a month later O traded down to $36.82 on 2020-03-191. That was a 55% drop and my question for you is: Was this because they paid a giant dividend or was it because the market panic sold during the onset of a pandemic?
Okay, so that was an easy one. Here’s a harder one: COVID is six years behind us, why has a great REIT like O still not fully recovered?
The answer: interest rates. Before COVID, the 10-year Treasury hovered around 1.5% to 2.0%. Today, it’s 4.65%. That means O has higher borrowing costs, sure. But because REITs compete with bonds, it means investors demand a higher yield from stocks like O. Last question: how do we get a company we do not control to comply with demand for a higher yield – politely ask for a large increase to their dividend or punish the stock price?
The interest rate climate could continue to climb, but there are those who believe now is exactly the time to start accumulating REITs again. Before rates come back down.
GuruFocus has a fair value of $61.
CFRA has a 12-month target value of $67.
Sure Dividend has a fair value of $71.
Morningstar has a fair value of $72.
Each acknowledges that O shouldn’t be trading at the highs achieved before COVID, because the current interest rate environment just can’t support that. But the estimates do range from ‘hey, it’s fairly valued right now’, to ‘O stands for oversold by about $10’. I think it is easy to see that upside potential below2.
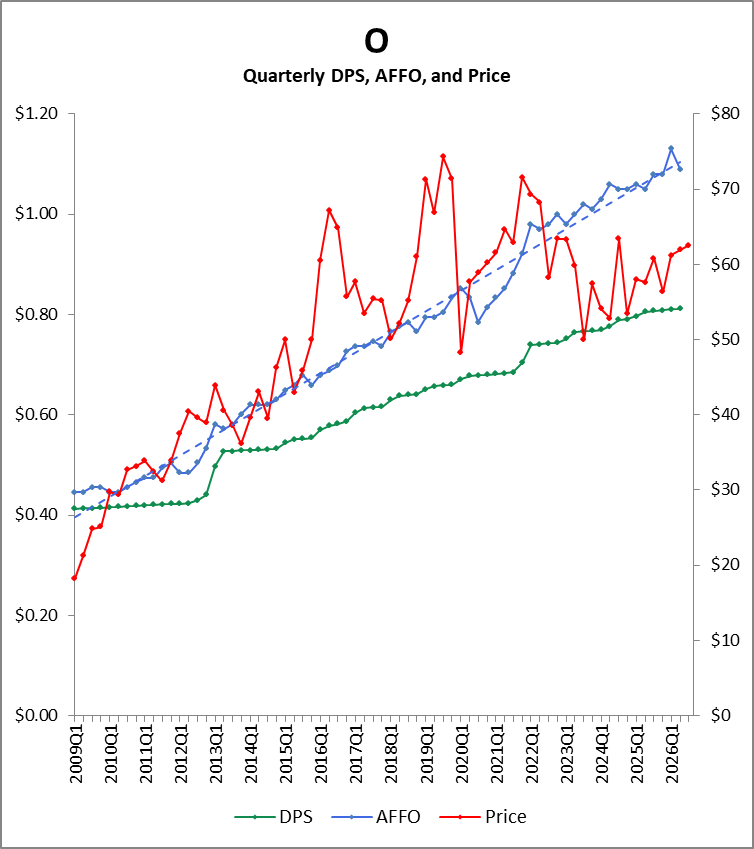
Graphically, it is easy to see that O, and many REITs like them, were priced at very high multiples back in the pre-pandemic glory days. So, it only makes sense that it would have to come down. But AFFO really only dipped for a couple of quarters and the strong growth trend has continued on as though nothing happened. O’s AFFO trend line is very steady and consistently increasing. But the price has gone from being overly optimistic about future growth to overly pessimistic.
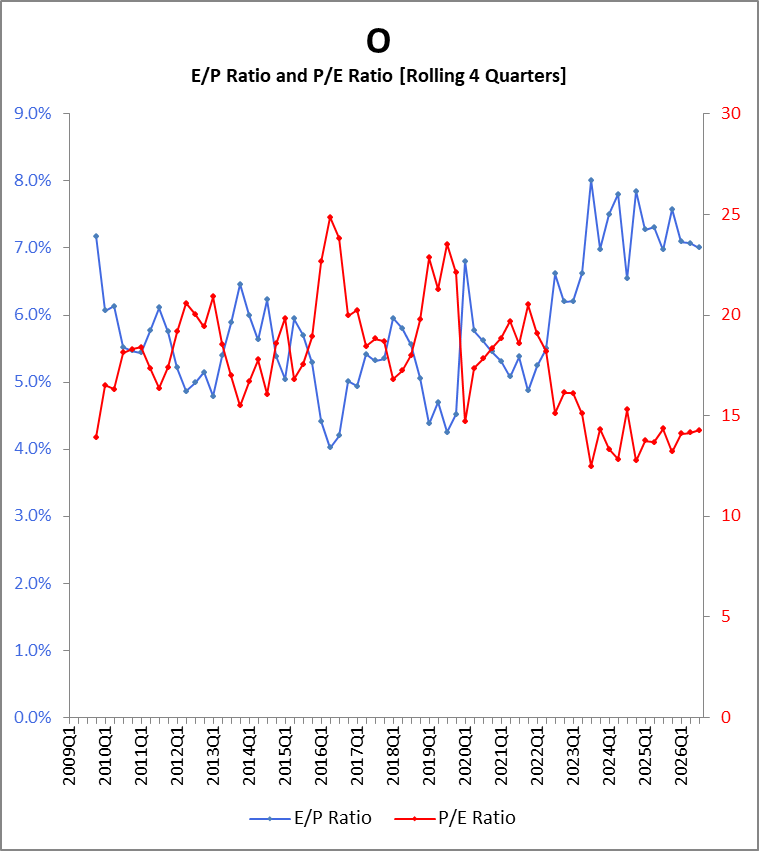
The market is no longer pricing REITs at the pre-pandemic multiples. They could certainly go lower, but how long can the market ignore such a strong, consistent trend in AFFO? That one is rhetorical.
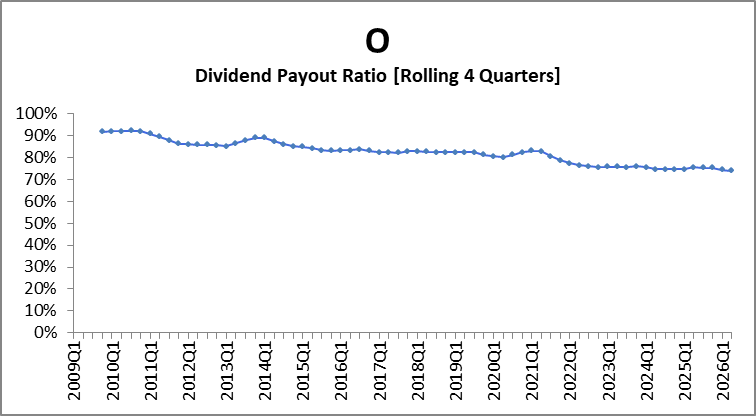
The payout ratio, in this case, DPS/AFFO has been steadily falling for nearly two decades.
O has 31 years of dividend increases and the current dividend is well-covered. In fact, they actually increase their dividend far more frequently than annually.
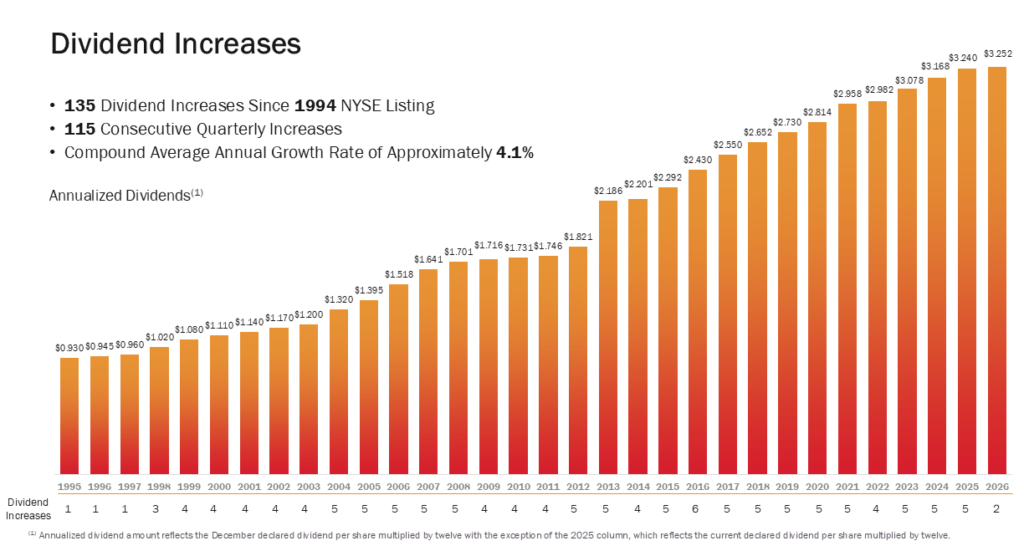
That chart. That’s the real reason for investing in O. It isn’t just a dividend machine. It isn’t just a monthly-paying dividend machine. It’s a quasi-quarterly dividend-increasing, monthly-paying dividend machine!
Consider this: even if someone bought $10,000 of O on 2020‑02‑20 and never reinvested a single dividend, they’d still be ahead today, sitting at roughly $10,340.
With O trading at what looks like a depressed level, and with interest rates potentially topping out, could this be one of those moments when O’s long‑term performance is stronger than usual?
I think you know the answer.
- These values are found on Yahoo! Finance and have been adjusted from the spinoff of Orion Office REIT [ONL] that took place on 2021-11-15. Values for those dates may be higher on other brokerage sites like Schwab’s ThinkorSwim which has not made an adjustment to historical prices for the spinoff. The unadjusted high and low would be higher by a factor of [1032/1000], i.e. 84.92 and 38.00 respectively. ↩︎
- What you won’t see are the extreme stock values I mentioned earlier. Those were intraday highs and lows and are not reflected in stock price values captured at the close of each calendar quarter. ↩︎