
The Portfolio for the Ages turns four today. Let’s take this opportunity to assess its performance.
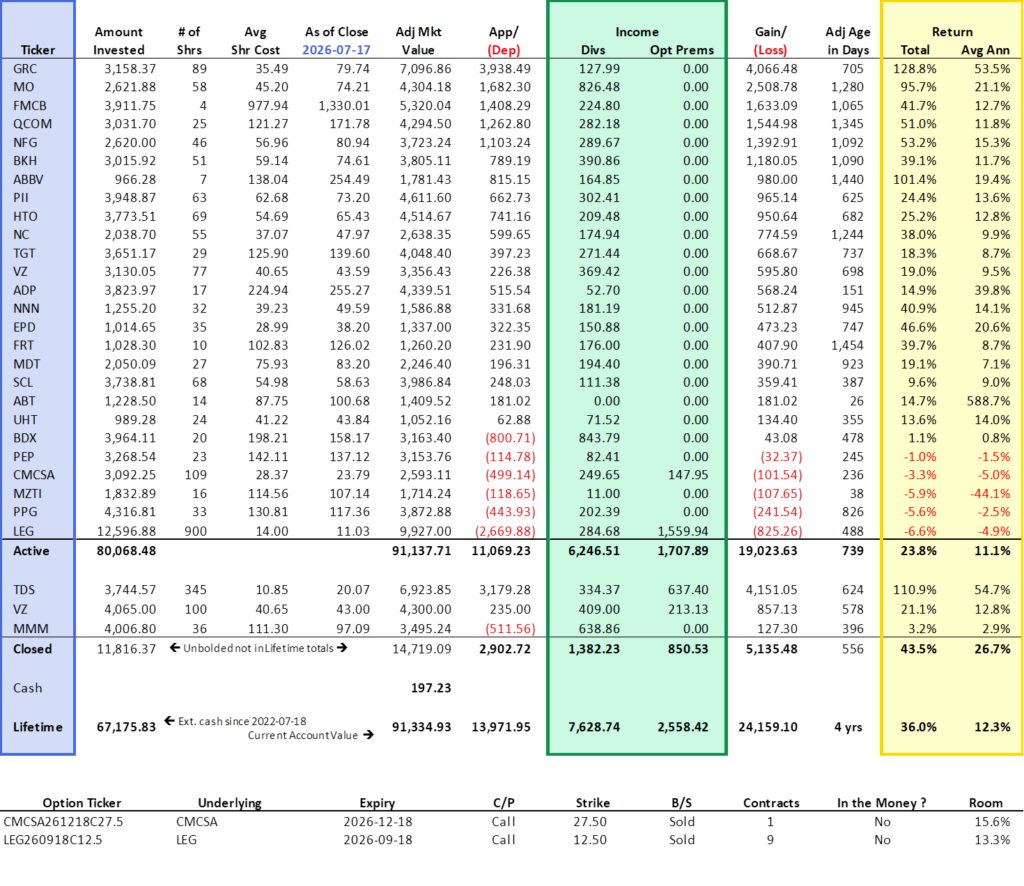
Investors who have found their way to this site always have access to the performance table below, updated weekly on the Performance page. This being a performance update, we start here.
Observations
- Total gain of $24,159.10 (includes realized and unrealized capital gains, dividends, and option premiums) is 36% of the $67,175.83 of outside capital invested. We have called this 36%, total return; however, it isn’t exactly easy to determine the annualized return from this figure (see discussion below).
- Total gain is comprised of price appreciation (57.8%), dividends (31.6%), and options (10.6%).
- Active holdings have an average annualized return of 11.1%.
- 21 of the 26 active holdings are in positive territory.
- The five stocks with an unrealized loss are excellent companies, all international in scale, all making money.
Those are just the observations from the table above. What is unseen is the importance of dividends.
Dividends
The following table is available on the Portfolio page and is also updated weekly.
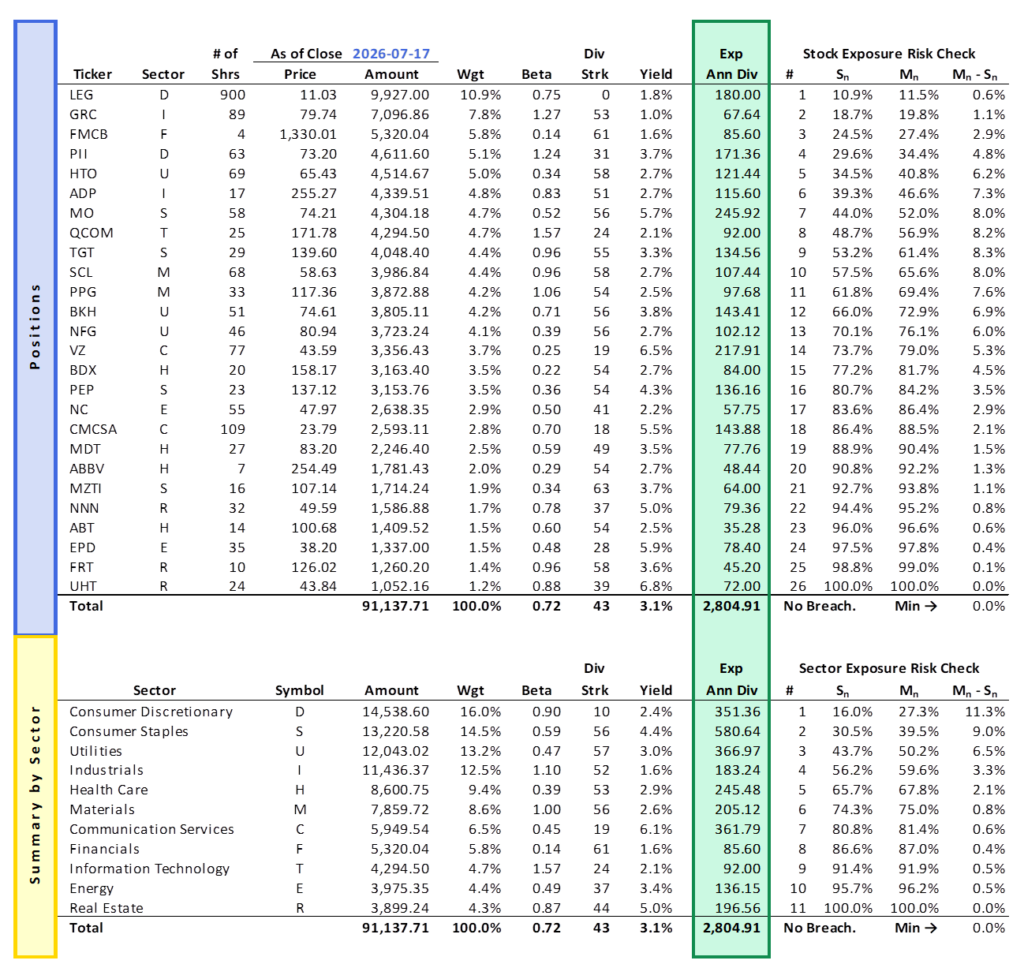
The portfolio is yielding 3.1% right now. However, that is influenced by large weights in three low-yielding stocks. An unweighted, straight average of the 26 stocks would yield 3.5%.
The portfolio stocks average a 43-year dividend increase streak and only one company, LEG, does not have a current streak. LEG is weighted more heavily at this time to capture the potential upside I anticipate when Somnigroup International’s [SGI] acquisition receives shareholder approval and nears finalization.
Without LEG, the portfolio’s weighted streak would rise to 48 years.
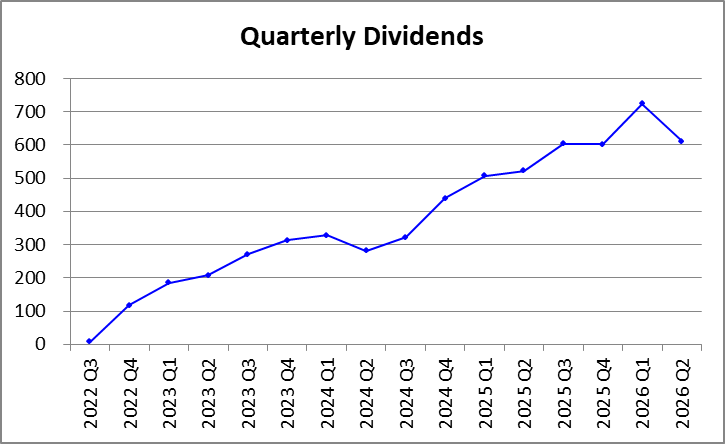
The figure in the first table above indicates that Royal Dividends has received $7,628.74 in dividends since inception. However, this figure includes the proceeds from three different spin-offs.
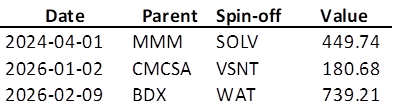
I have stripped these amounts out of the charts below to better illustrate the timing and magnitude of true dividends. I’ve made no effort to select companies based on the months in which they pay dividends. Additionally, the charts below are through June 2026 as the month of July, and the calendar quarter to which it belongs, is not yet complete.
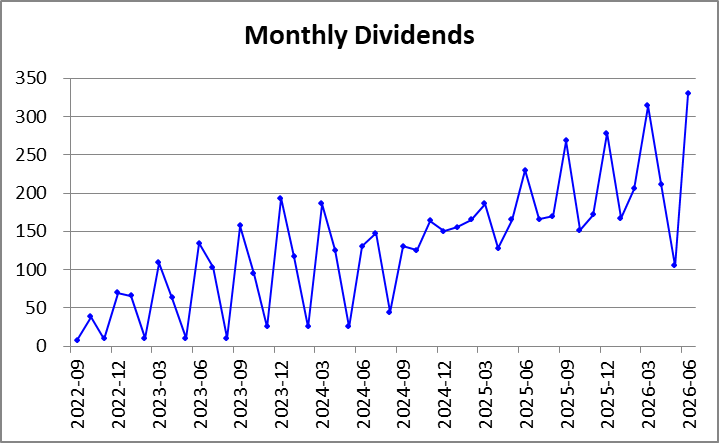
The recent low point in May 2026 is the result of selling 100 shares of high-yielding VZ and reinvesting those proceeds into the low-yielding LEG.
Portfolio Return
The dividend charts above are visually boring, but make no mistake, increasing dividends are of paramount importance and one day they will make putting outside money into the fund unnecessary. More on the power of compounding dividends later.
Some Context and a Starting Point
There is always pressure1 to measure performance against a benchmark, but the Portfolio for the Ages is a different creature entirely. It is an actively managed collection of history’s strongest dividend‑paying companies, enhanced by strategic option‑selling for additional income. It has no true analogue. Rather than forcing a comparison to a benchmark with mismatched goals and constituents, it makes more sense to use a broad market backdrop as context for how Royal Dividends operates.
The S&P 500 Index [SPX] might seem like the obvious choice, yet—as I’ve written before—it is a poor proxy for the broader market. Its internal imbalance is extreme: the ten largest companies by market value now carry nearly the same weight as the other 490 combined. That distortion makes it an unreliable stand‑in for the environment in which this portfolio is actually competing.
Instead, we’ll use the equally weighted S&P 500 Index [SPXEW].
Unfortunately, using the SPXEW ticker to quickly grab total return with dividends is sheer misery. To assess the performance with dividend reinvestment, it is much more convenient to look at the total return of the Invesco S&P 500 Equal Weight ETF [RSP].
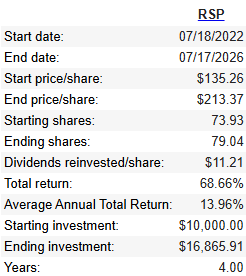
Nearly 14% per year over four years? That’s not going to be easy to beat.
Let’s begin by laying out the key figures and use them to estimate the Portfolio for the Ages’ average annualized return over the four‑year period, while incorporating the complication of ongoing weekly contributions of $250 or more.
A) Beginning value of the portfolio: 0.00
B) Ending value of the portfolio: 91,334.93
C) External contributions during the period: 67,175.83
D) Dividends received: 7,628.74
G) Realized + unrealized gains: 13,971.95
P) Option premiums received: 2,558.42
These figures appear in the first table above, and as expected, B = A + C + D + G + P.
Rethinking the 36% Total Return
The 36% total return shown in the table implicitly assumes that the entire $67,175.83 of outside capital was invested on 2022-07-18, the very start of the period. That obviously isn’t true, and the annualized return derived from that assumption,
understates the actual performance. It understates it because it treats the average invested capital as equal to the total contributions, ignoring the fact that capital was added gradually over time.
A More Realistic Approximation
Because contributions were made regularly and in roughly equal amounts throughout the period, we can make a simplifying assumption: treat all contributions as if they were invested halfway through the four‑year span—i.e., on 2024-07-18. Under this assumption, the average invested capital is half of the total outside contributions.
The implied return for the Portfolio for the Ages is therefore:
This result is roughly double the original total return. Spread over four years, it implies an annualized return of:
This estimate is more realistic in that it accounts for the staggered deployment of outside capital. However, it also assumes that all dividends, option premiums, and gains were received at the end of the period. That clearly isn’t the case; dividends and premiums began arriving soon after the first positions were opened and were reinvested continuously. Gains likewise accumulated throughout the period. None of these cash flows could have occurred if all capital had been invested suddenly at the midpoint.
As a result, this method overstates the annualized return by effectively attributing all portfolio growth beyond contributed capital to just two years of compounding.
The Real Answer Lies Between the Extremes
The true annualized return is somewhere between 8.0% and 14.5%. Given the timing of contributions and the steady reinvestment of dividends and premiums, the actual figure is likely close to the average annualized return of the actively held positions, which is calculated more reliably and currently stands at 11.1%.
For now, I’m using a simple average of the two annualized return estimates: one derived from the 36% total return, and the other based on the assumption that contributions were made uniformly throughout the period.
Long ago, I stated that I was not exactly trying to outperform the S&P 500 Index, equally weighted or not. I wanted to see safe returns of 8% or more with less volatility and so far, so good.
Compounding
Warren Buffett has called compounding the eighth wonder of the world, and for good reason. It is a quiet force—slow, steady, and astonishingly powerful over time. The Portfolio for the Ages is deliberately structured to create the most fertile environment possible for compounding to flourish. Think of it as a petri dish of investments allowed to thrive in a controlled environment.
Account values will rise and fall with market sentiment and the natural ups and downs of individual businesses. Dividends, however, should only move in one direction: upward. Portfolio income grows through six reinforcing engines:
- Annual Dividend Increases: With the exception of LEG, every holding has a long record of raising its dividend each year—an unweighted average streak of 47 years.
- Dividend Reinvestment: Every dividend received is optimally reinvested into the best current opportunities, increasing share count and future income.
- Capital Gains Reinvestment: Any realized gains from selling a position are recycled back into the portfolio.
- Option Premiums Reinvestment: Income generated from option activity is reinvested to accelerate growth.
- Consistent Outside Capital: Each week adds another $250+ of fresh capital, strengthening the compounding base.
- Scaling Into Covered Calls: As reinvestment and contributions expand the portfolio, more positions will reach 100 shares. These lots can support covered call writing, creating additional income (#4) and occasionally capturing capital appreciation through assignment (#3).
The companies increase their dividends per share (#1), and we steadily increase the number of shares we own (#2–#6). The result is a dual mega-engine of growth—one driven internally by the businesses themselves, and the other driven externally by disciplined reinvestment and contribution.
This is how inconceivable wealth is amassed2.
- Self-induced pressure, but it is still very real. ↩︎
- Even the casual observer will note that Tesla Inc [TSLA], Space Exploration Technologies Corp [SPCX] and their like are not in the portfolio and not even in the Royal Dividends Empire. But even if they did pay dividends and had been around long enough to possess impressive dividend increase streaks and for once in their life were significantly undervalued enough to rank in the Top Ten, they would still never make it into the Portfolio for the Ages. Elon Musk is competition. ↩︎