
On 2024-11-29, the equally weighted S&P 500 Index [SPXEW] reached an all-time high of $7,612.31. SPXEW found itself down 20% from the all-time high on 2025-04-07. Since then, the market has climbed nearly all the way back and is now down just 2.5% from the high. In fact, just three days ago, the market weighted S&P 500 Index [SPX] reached a new all-time high. But that’s essentially all because of Nvidia [NVDA] which has doubled since April 7th.
The Portfolio for the Ages turns three today. It has not doubled since April 7th. Let’s talk about that.
Before looking at the performance of the portfolio, let’s put NVDA into perspective. Here are the sector market capitalization weights comprising SPX.

Eleven sectors, but Information Technology is a whopping one third of SPX. This is why while it might make for a good passive investment, SPX is not exactly balanced. And frankly, it isn’t as diversified as it seems either. Below, NVDA has been split out from Information Technology.
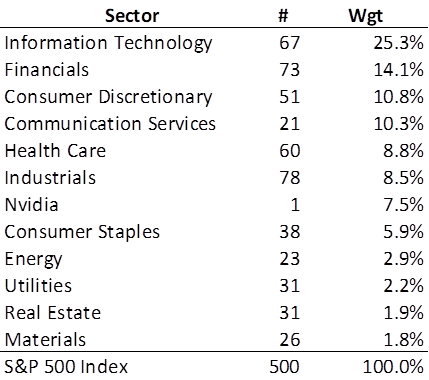
Information Technology is still a massive 25% of the Index, but that is hardly the story. If NVDA were a sector of its own, it would be the seventh largest by weight. It’s more than Materials, Real Estate, and Utilities combined! From this perspective it is easier to see how SPX has outperformed SPXEW.
As I’ve said before, I reference SPXEW, not really as a benchmark on which to compare performance results, but rather to speak of the market in general. Being equally weighted, it gives a more balanced picture of the average performance of the 500 stocks that make it up.
Now on to the matter at hand.
Observations
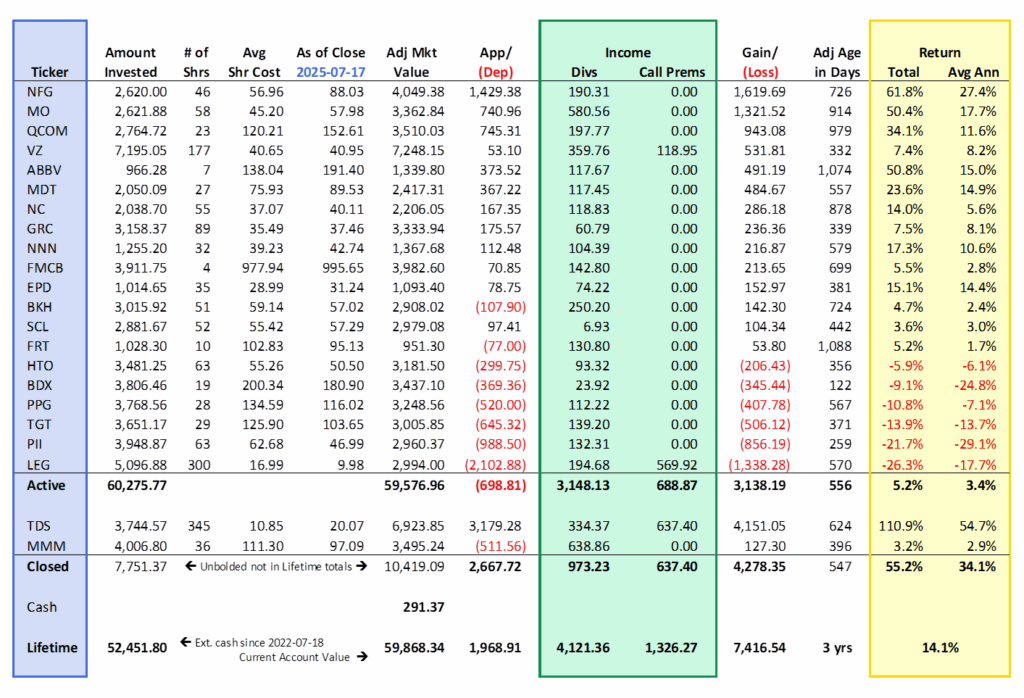
- Total return (includes realized and unrealized capital gains, dividends, and call premiums) is 14.1% since inception.
- Active holdings have an annualized total return of 3.4%.
- Fourteen of the 20 holdings are in the black.
- The bottom six stocks are excellent companies.
- Gains have come from price appreciation (26.5%), dividends (55.6%), and options (17.9%).
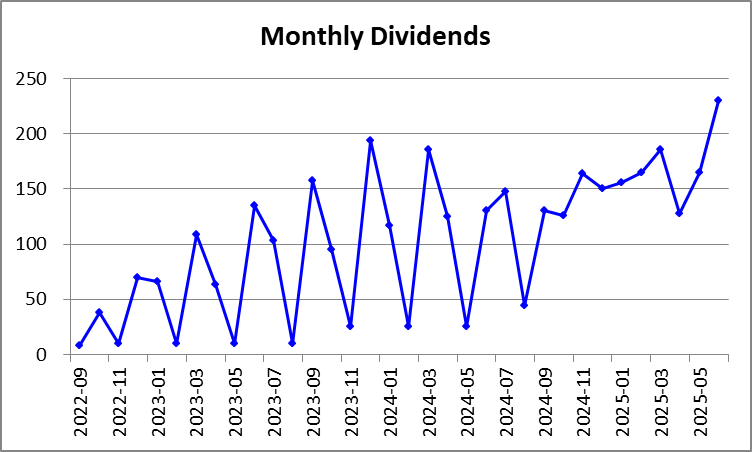
Those are just the observations from the chart above. What is unseen is the importance of dividends. LEG is the only stock that has failed to increase its dividend; the others continue their long streaks of annual increases in their dividend. The figure in the chart above indicates that Royal Dividends has received $4,121.36 in dividends since inception. However, this figure includes $449.74 in proceeds from the SOLV spinoff from MMM in 2024Q2. Taking a closer look at the $3,671.62 in pure dividends on a monthly basis, we see quite a bit of volatility, largely because I’ve made no effort to select companies based on the months in which they pay dividends.
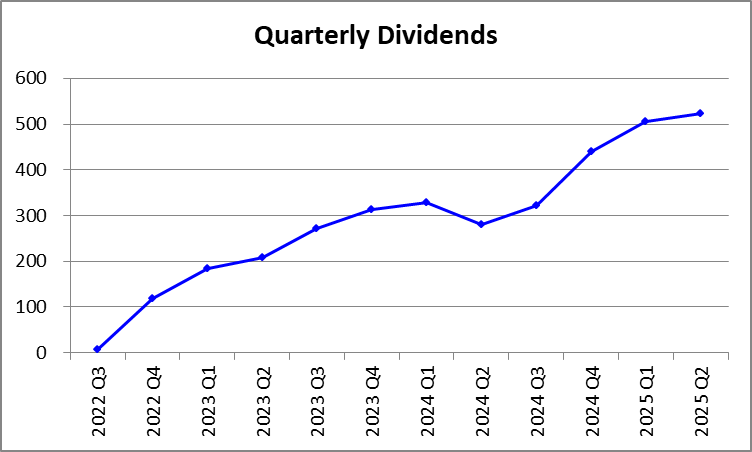
On a quarterly basis, we see a smoother picture and dividends are only going to continue to rise.
There are two covered positions in the portfolio, both expiring on 2025-10-17: 3 contracts on LEG with a strike price of $15 and one contract on VZ with a strike price of $44. Neither are in the money at this time.
As the portfolio grows, more positions will grow beyond 100 shares and those positions will become eligible for call selling. This will be both a catalyst for income and the capture of capital appreciation via call assignment.