This week, five of the portfolio holdings ranked in the Top Ten: FMCB, GRC, PPG, SJW, and TGT.
| Ticker | Account Value |
| FMCB | 4,012.00 |
| GRC | 3,131.91 |
| PPG | 3,100.44 |
| SJW | 3,238.83 |
| TGT | 2,081.20 |
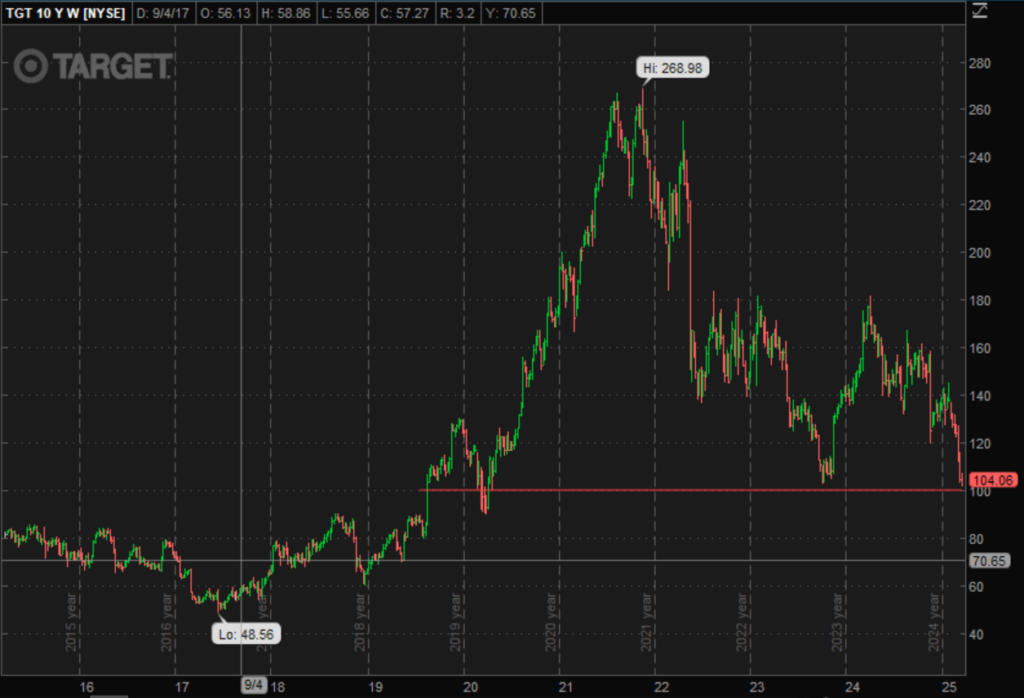
The lowest amount belongs to TGT which last traded at $104.06. I will acquire 3 shares of TGT on Monday morning. Below, is the purchase history and average cost calculation.

TGT announced earnings on 2025-03-04 so it is time to take a fresh look at how those results fit into the last 16 years of performance. I emphasize ‘look’ here because I mean it quite literally. The graphs below provide visual information within a historical context. As I’ve noted before, for those interested in very detailed data on the latest earnings, I highly encourage reading the corporate press releases and listening to the earnings conference calls. I practice what I preach and have read many press releases and listened to recorded versions of conference calls. However, I am loathe to present duplicative content here at Royal D; I would rather present something that I myself can never find on the internet or am unwilling to pay for.
Comparisons of actual to expected results are not my cup of tea either. Certainly, there is positive correlation between stock price and earnings surprises, but it is not a strong correlation; all too often a price simply doesn’t move in a logical way post-earnings announcement. Higher than expected revenue (top line) and better than expected earnings (bottom line) for the quarter can be undone by a company lowering guidance for the upcoming year. Or undone for zero reason whatsoever.
So, for me a simple graph like the one below can give you an idea of actual performance relative to the past and not relative to the expectations of the experts following the company or to the company’s own expectations.

And so, what do we see?
Observations
- The linear trends for price and EPS are noted, not for what they reveal, but for what they do not reflect. They reveal that both price and EPS have moved at the same pace over time. However, those trend lines have become increasingly ill-suited as gauges for either metric because of the increase in volatility of those metrics. There is an argument for TGT being substantially undervalued at this time, it just isn’t at all captured in the linear trends.
- Volatility in EPS appears to be declining and approaching the tempered and more predictable pre-COVID levels.
- Of course, dividends are steadily increasing regardless of the noise. We are dealing with a King after all.
- The P/E Ratio is 11.74 and the E/P Ratio is 8.5%. These levels (obviously, correlated by the fact that one is the inverse of the other) do not happen frequently. This is a buying opportunity that happens perhaps every 6+ years.

- CY2024 EPS of $8.86 may be well off the all-time highs of $13.55 for CY2021, a post-COVID rebound year, but it was still 38% better than the CY2019 EPS of $6.40 which just so happened to be the best year ever prior to 2020. Thus, to see TGT trading at levels first seen in 2019 is an opportunity.

This is one of those critical points where I expect a stock to bounce off of long-established support, particularly because EPS is substantially greater than when the stock first broke through that price level, i.e. when that level had stopped being a ceiling.
TGT is a company whose share price often fluctuates irrationally and unpredictably, influenced by the collective mood of a populace prone to politicizing all aspects of life—organic or inorganic. In such an environment, information, regardless of its accuracy, credibility, or underlying political intent, seems to illicit immediate reaction. These reactions, driven by impatience, bias, and a lack of critical understanding, frequently result in disproportionate responses. The outcome? Significant share price volatility, spurred by insignificant data, amplified by the collective actions of a significant number of insignificant people.
TGT has a well-supported dividend that has increased 53 consecutive years and yields an uncharacteristically high 4.3%. Not only will I continue to shop there, but I will also increase my 0% ownership stake on Monday.
