
This week, five of the portfolio holdings ranked in the Top Ten.
| Ticker | Account Value |
| ADP | 5,139.27 |
| CMCSA | 4,094.16 |
| HTO | 4,343.55 |
| PEP | 4,086.97 |
| PPG | 4,038.54 |
The lowest amount belongs to PPG. We will acquire 3 shares of PPG on Monday morning. Below, is the purchase history and average cost calculation.
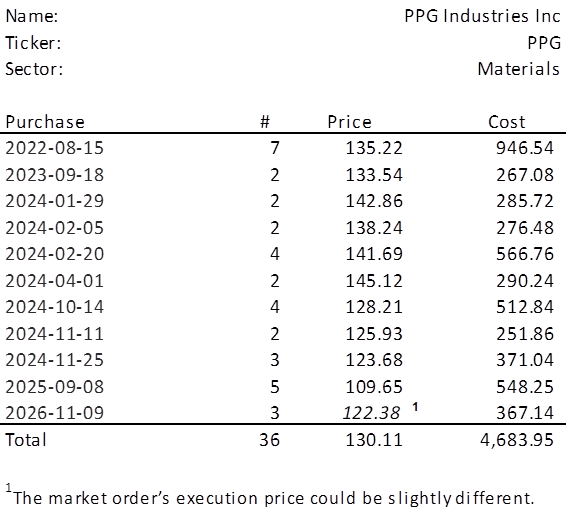
Fourteen months have passed since we added to this position. Let’s see how recent earnings fit into the broader arc of the past seventeen years.
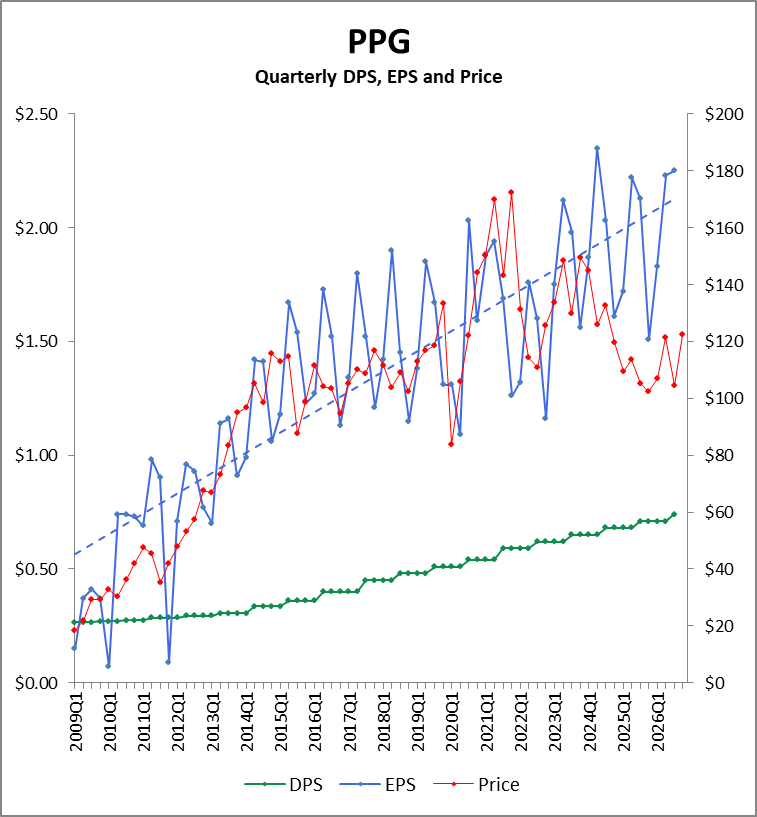
Observations
Stock Price
After reaching an all-time high of $182.97 in June of 2021, PPG’s share price has gone through a rather long and volatile price consolidation. The truth is, that run-up to the all-time high was undeserved. People, they sell paint – let’s not lose our minds now. But I would argue that trading all the way down to $90 in April 2025 is equally absurd. PPG’s stock price has considerable volatility despite an at-market level of beta. Once upon a time, I assessed the ‘natural channel’ in which I thought PPG was moving and simply projected into the future and now it would appear that is has climbed back up into that channel a little bit more consistently than in late 2025.
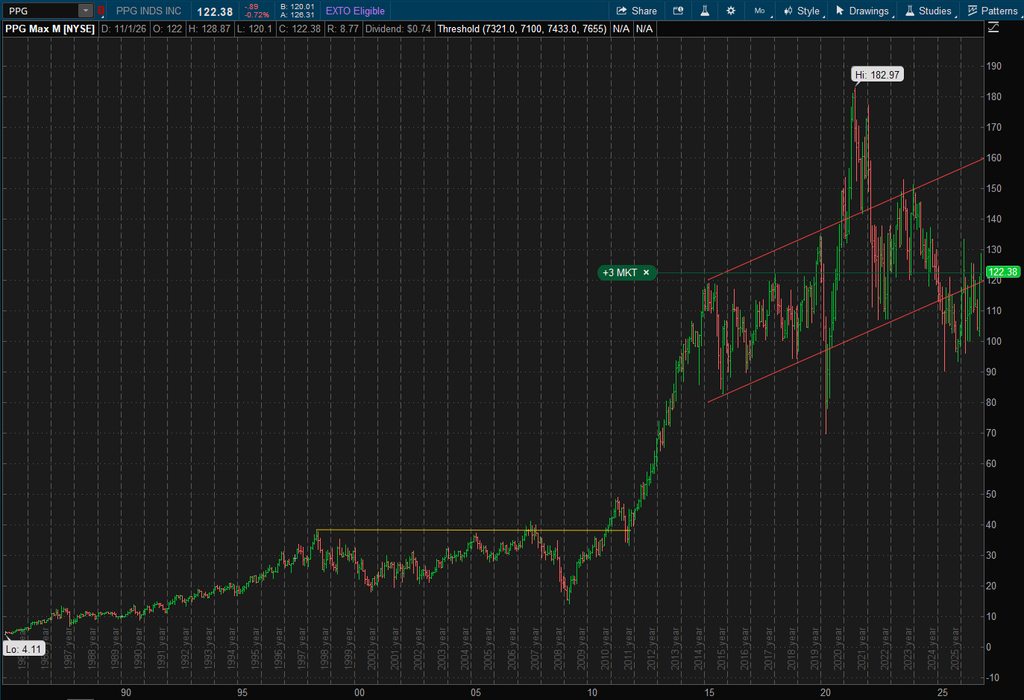
This last burst up into the channel came immediately after their last earnings announcement which we will get into, but barely. At the very least, even if the channel I’ve drawn is irrelevant and not applicable, there is certainly a series of higher lows observable over the last two years1.
Earnings
Magnitude/Trend
Clearly, the quarterly earnings remain in a strong, long-term, positive trend as is depicted by the blue dotted line in the chart above. 2026Q3 EPS of $2.25 is a 5.6% improvement over the same period in the prior year. The first three calendar quarters are 4.0% higher than the same period of the prior year.
Seasonality
Typically, the quarterly distribution of annual earnings breaks down as follows: 20.9% in Q1, 29.5% in Q2, 28.4% in Q3, and 21.2% in Q4. Remarkably, the variation around these percentages is minimal. The difference between the halves of the calendar year is negligible with the first half typically coming in at 50.4% and the second half at 49.6%.
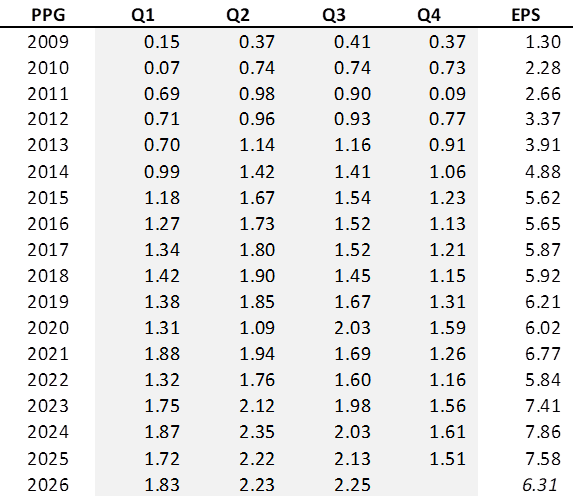
With the first three calendar quarters coming in at $6.31, and the historical average of said time frame representing nearly 80% of a full year’s earnings, it isn’t difficult to see how CY2026 could set a new record, coming in at $8.00 or more.
Dividends
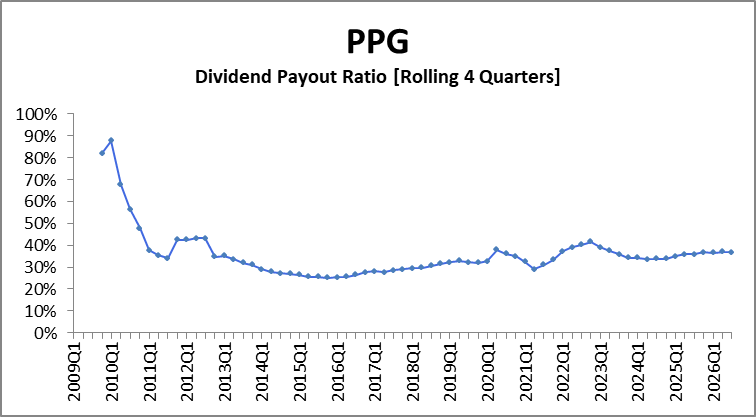
PPG is a Dividend King, with an impressive 55-year streak of consecutive dividend increases. The dividend currently yields 2.4%, while the payout ratio remains quite safe at 37%.
I expect the dividend to continue growing safely for the foreseeable future.
Thoughts on Investment
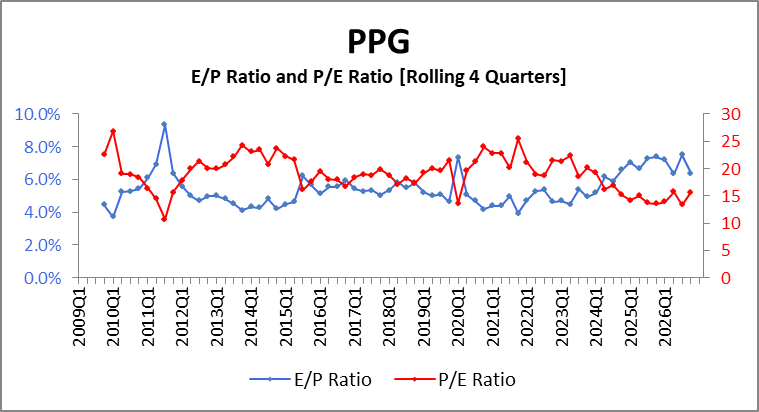
The trailing 12-month P/E ratio is currently 15.65, lower than the average for PPG of 19.03 over the period above.
Whether or not CY2026 will set a record for EPS, there is nothing to suggest PPG won’t keep raising its dividend annually. Perhaps PPG’s annual growth rate won’t rival the past, and the stock may deserve a lower multiple, but as low as 15.65? As Gorilla Monsoon would say to Bobby ‘The Brain’ Heenan, “Please. Give me a break.”
CFRA, GuruFocus, Morningstar, Sure Dividend, and Simply Wall St, have their fair value estimates or 12-month targets falling within a range of $125 to $152.
Simply Wall St. says there are 22 analysts following PPG and that their 12-month target averages out to $130.14. However, they have a display that shows the range about that average estimate and also how that range and average have tracked over the recent past as well. It makes for a great visual:
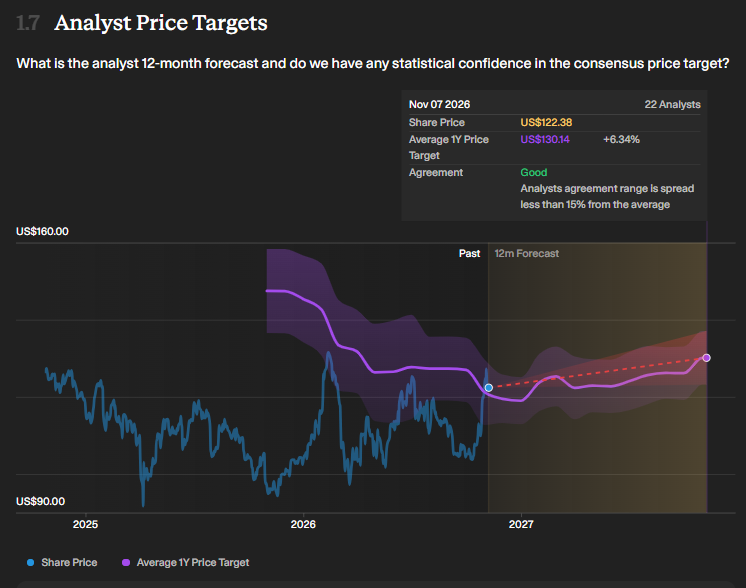
For me, the investment case is simple. Despite trading at $122.38 today, PPG’s share price is barely above where it was trading nearly twelve years ago, in March of 2015. Earnings, on the other hand, have grown substantially during that time. While growth hasn’t occurred in a perfectly straight line, the long-term increase in profitability is hard to ignore.
- I certainly could have added a sloped trendline to emphasize the rising lows. However, the screenshot originates from ThinkorSwim, and producing a chart fit for human consumption requires disabling a host of indicators and custom studies before taking the screenshot, then re-enabling them afterward so I can continue pretending they’re indispensable tools on my march toward absurd wealth. Having already performed this ritual once to show the channel, I naturally thought of the additional trendline only after the screenshot was finished. The regret was immediate. However, repeating the exercise now would merely reward inadequate forethought and encourage future lapses in judgment. This is how we learn. Did typing this footnote take far longer than making a new price chart? You better believe it. ↩︎