
This week, six of the portfolio holdings ranked in the Top Ten.
| Ticker | Account Value |
| ADP | 4,887.16 |
| BDX | 3,790.40 |
| HTO | 4,384.95 |
| MZTI | 2,526.48 |
| PEP | 3,244.61 |
| PPG | 3,769.26 |
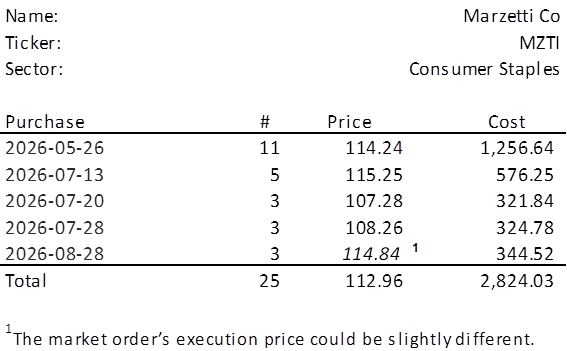
The lowest amount belongs to MZTI. We will acquire 3 shares of MZTI on Monday morning. Below, is the purchase history and average cost calculation.
MZTI announced earnings for 2026Q2 three days ago and, three days later, there has been no appreciable effect. So, we shall try to place this recent performance into a far longer context of 17+ years, but before we do that, I would like to get a couple of items out of the way.
First, Telus Corp [TU] is no longer a Royal Heir within our investing Empire. The Communications Services sector is apparently a difficult one in which to do business, and significant dividend increase streaks are hard to come by. After 22 years, their streak breaks with the 2026-07-31 announcement of a 55% cut to the dividend.
Second, LEG is no longer publicly traded. Shareholders of LEG approved the sale of LEG to Somnigroup International Inc. [SGI], and SGI has completed their acquisition of LEG as promised – each shareholder receiving 0.1455 shares of SGI for every share of LEG and cash in lieu of any fractional shares. Royal Dividends saw their 900 shares of LEG replaced by 130 shares of SGI plus $61.68 in cash in exchange for the remaining 0.95 shares.1 Further, the 9 call options we had with a strike price of $12.50 and an expiry of 2026-09-18 have been adjusted accordingly as a ‘SGI (14/100)’ listing.
We still hold 9 contracts and we still have a strike price of $12.50. However, to assess the ‘moneyness’ of the calls, one needs to multiply the current price of SGI by 0.14 and compare the result to $12.50. As of Friday, that product is 64.37 x .14 = $9.01, well under the strike price and not very likely to be called away in three weeks.
The Portfolio and Performance pages have been adjusted to reflect this change. The position has essentially gone through a ticker symbol change, and the historical cost information has been adjusted as though we spent an equivalent amount of money to acquire the requisite number of shares of SGI in the past. No unrealized losses are being captured at this time and our position’s financial performance remains unchanged accordingly.
Now for a brief look at MZTI’s recent performance…
Observations
Stock Price
After reaching an all-time high in May of 2023, MZTI’s share price went through a rather long and volatile price consolidation. Until recently. The four-month slide from February through May of this year has been significant and MZTI actually fell through what I would have considered a support around the $117 level.
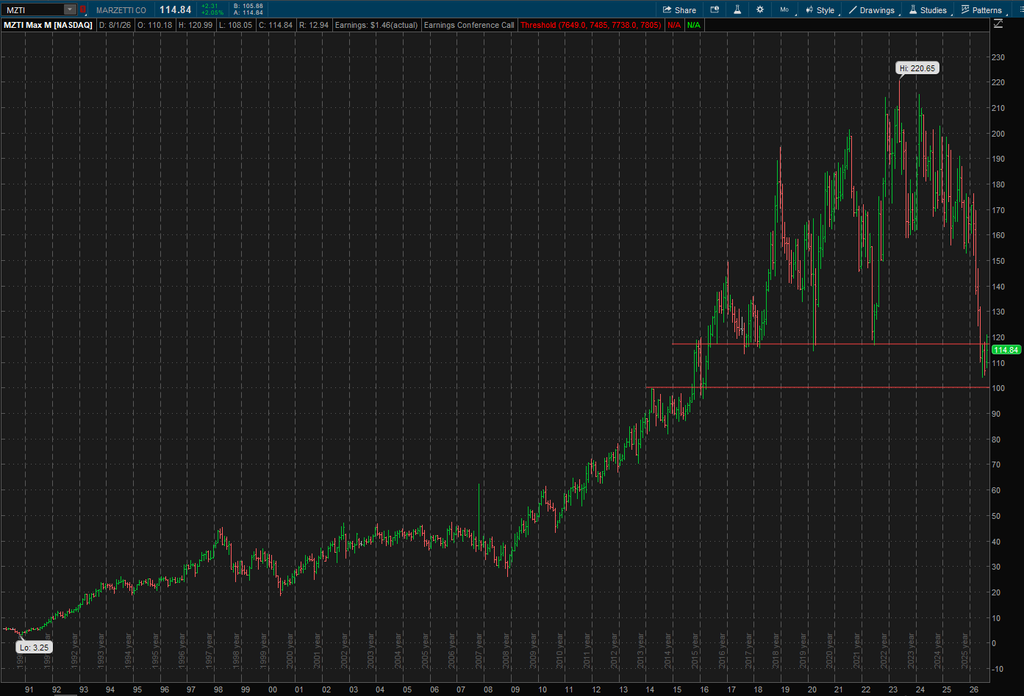
It has come back up above that level, but it really wasn’t because of their recent earnings announcement – the price improvement preceded the announcement. Time will tell if the price holds above $117 now or if perhaps, we find a retracement all the way to $100 before finding support.
Earnings
Magnitude/Trend
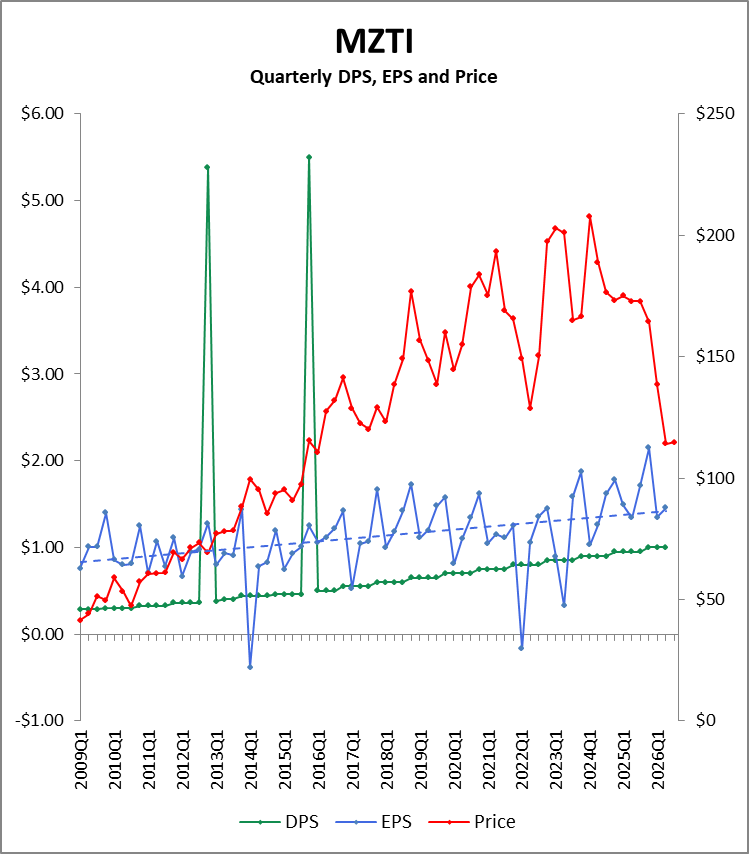
Clearly, the quarterly earnings remain in a strong, long-term, positive trend as is evinced by the linear, blue dotted line in the chart above. 2026Q2 EPS of $1.46 is a 9% improvement over the same period in the prior year and a record for Q2 earnings. Q2 closed out their fiscal year with an all-time high EPS of $6.67, up 7% over the previous fiscal year.
2026H1 EPS of $2.81 was just 2 cents shy of the 2025H1 EPS of $2.83, their best start to a calendar year ever. But I guess that’s enough to continue punishinng the stock.
Seasonality
Typically, the quarterly distribution of annual earnings breaks down as follows: 15.8% in Q1, 23.3% in Q2, 26.8% in Q3, and 34.1% in Q4. With the exception of Q1, the variation around these percentages is minimal. The difference between the halves of the calendar year is a bit more pronounced with the first half typically coming in at 39.1% and the second half at 60.1%.
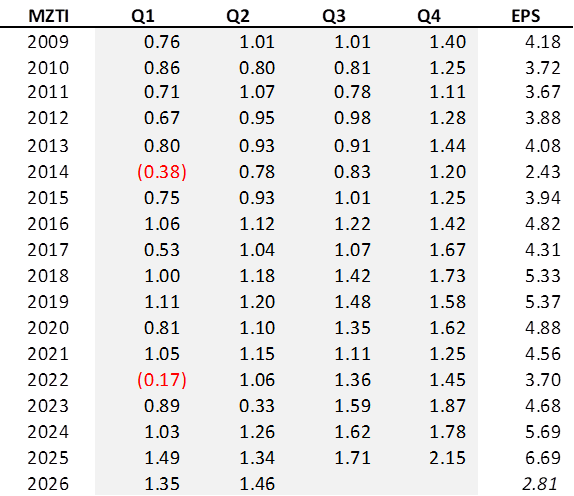
As I mentioned, MZTI’s fiscal year ends with the Q2 of the calendar year and there is no guidance available for the next two calendar quarters. Therefore, some liberties have to be taken in order to visualize how this calendar year might end. With 2026H1 EPS of $2.81, and the historical average of H1 representing 39.1% of a calendar year’s EPS, it isn’t difficult to see last year’s record high of $6.69 falling to a new record of $7.19. BUT! If you throw out 2014 and 2022 when the Q1 EPS was negative, the typical H1 of a CY is more like 42%. And what if $2.81 ends up as 42% of the whole year’s EPS, well then that EPS would be about $6.69.
Folks, MZTI could very easily see 2026 as their best calendar year ever. Even so, could the stock be trading even lower by the end of the year? You know it.
Dividends
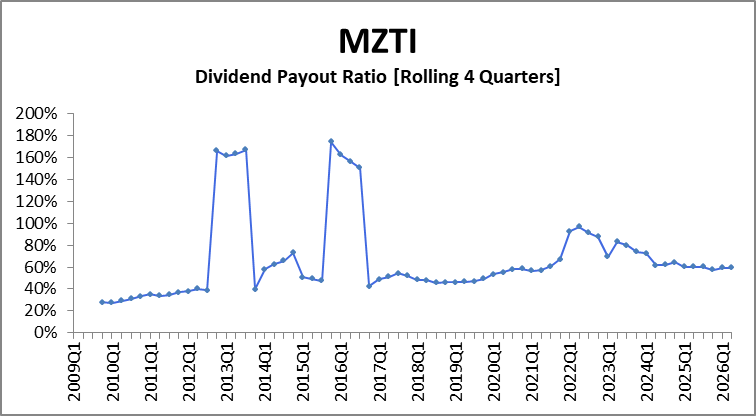
MZTI became a Dividend King 13 years ago! They pay dividends and they increase those dividends annually. The dividend is currently yielding 3.5% and the payout ratio is a very safe 59%.
Thoughts on Investment
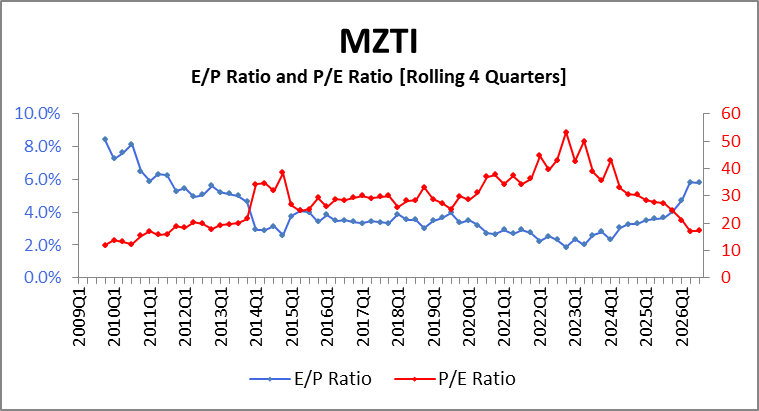
The trailing 12-month P/E ratio is currently 17.22, lower than the average for MZTI of 28.36 over the period above.
Whether or not CY2026 will set a record for EPS, there is nothing to suggest MZTI won’t keep raising its dividend annually.
Further, Morningstar, Sure Dividend, GuruFocus, and Simply Wall St, have their fair value estimates falling within a range of $138 to $204, while the average from analysts who follow MZTI is near the lower end of that range with $146.
Clearly there is more upside potential than downside and that is how a stock finds its way to #1 in a weekly Top Ten.
- Incidentally, this implies an SGI price of (61.68/0.95) = $64.93. ↩︎