Today, the U.S. Bureau of Labor Statistics released its latest report on the Producer Price Index (PPI). In about 9 hours, they will release its latest Consumer Price Index (CPI) report. The PPI report came in slightly worse than expected, and the market responded accordingly with a 0.32% drop. The market is hoping for a good CPI report because that would be an indication that the Fed’s rate increase and monetary tightening policy to address rampant inflation is working. In fact, the market really wants a stellar report. That would be cause for the Fed to reconsider its aggressive policy and avert a deep recession.
I believe the market is going to be disappointed.
Today’s PPI Results
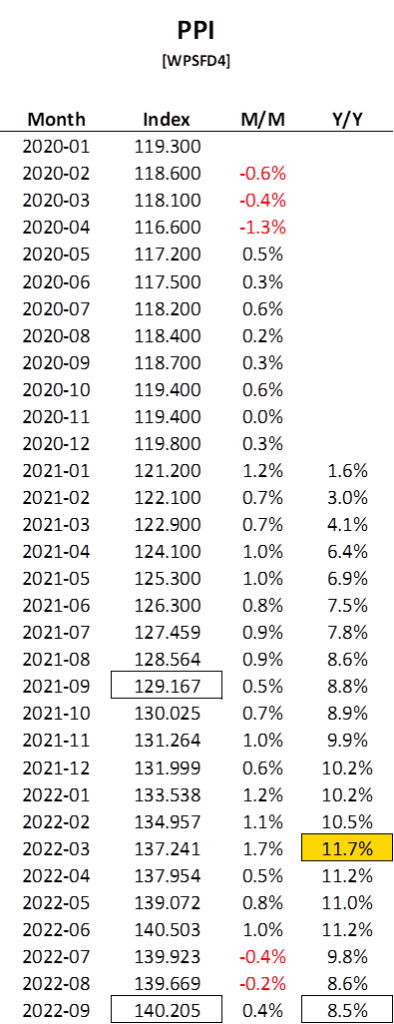
When folks in the news state that the PPI went up 0.4% over last month and 8.5% for the year, they are referring to the specific index titled, ‘PPI Commodity data for Final demand, seasonally adjusted’. It has Series ID WPSFD4. You’ll see those numbers in the bottom row of the table below.

The PPI reached its peak in March. We’ve seen declines in three straight months, and this would suggest the Fed’s policy is working, albeit slowly. Note that the right-most column is a rolling 12-month trend. In other words, 140.205 is 8.5% higher than last September’s 129.167 value.
Tomorrow’s CPI Results
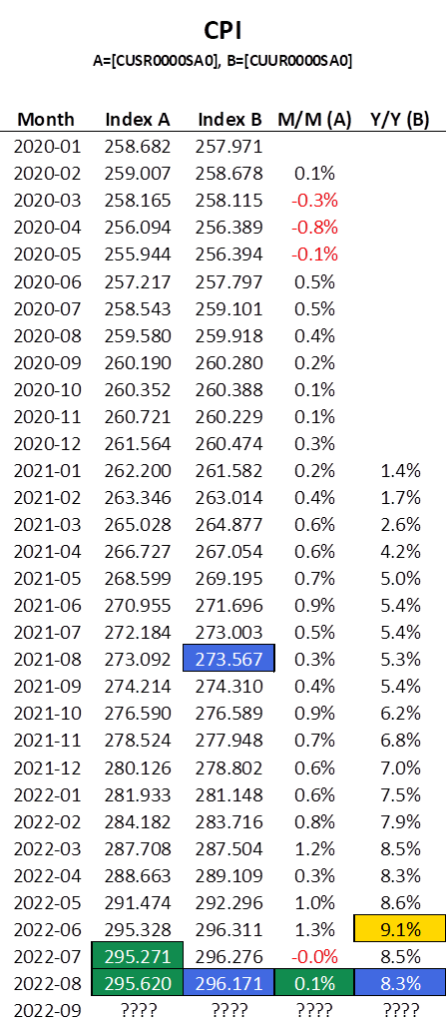
Now let’s take a look at the CPI data that was last reported on September 13, 2022.

The month-over-month numbers use the seasonally adjusted Index A and the year-over-year numbers use the unadjusted version, Index B. I’ve color coded the numbers to aid in the visualization. The year-over-year measure of inflation peaked in June and has come down two consecutive months.
You might be wondering whether the results of the PPI report are predictive of what we’ll see in the CPI tomorrow. In fact, the correlation coefficient between the CPI and PPI monthly changes is 0.65; they’re highly correlated.

My Prediction
If I apply the regression formula and use the September 2022 PPI monthly change number of 0.4% as my independent variable X, the last row of the table would read:

The rolling 12-month trend is made up of a numerator and a denominator. The news will only ever refer to the numerator, and indirectly at that. In other words, reporters will speak of the most recent month’s change over the previous month. Everyone wants to know how September 2022 was. If the increase is as the regression formula predicts, 0.4%, the market will undoubtedly tank. But of equal importance is the denominator, and we’ve known about that number for a year. I’ll explain.
If my regression estimate proves to be exact (a near 0% probability), the year-over-year change would be derived as:
[(297.268/274.310)-1] x 100% = 8.4%
We are looking at the change between September 30, 2022 and September 30, 2021. Those are considered to be month-end snapshots. In other words, September 2021 is not in the calculation anymore. Unfortunately, the end of September 2021 number, 274.310 was only a 0.4% increase over the previous month (Aug 2021, 273.567). When we move forward in time, we want the month that is dropping out of the 12-month range (in this case, September 2021) to have been a particularly bad month. We want the denominator to be as high as possible, and that won’t happen unless the percent change over that month was relatively large.
The next six months all increased more than September 2021. The annual change in CPI should have an easier time coming down when it is reported again in November, when we lose October of 2021, a particularly bad month (a 0.9% increase). We could even have a bad October 2022, with an increase of say 0.5% and we would still see significant improvement in the 12-month trend, all because the month dropping out was worse than the most recent month.
I hope I am wrong about tomorrow.
