
This week, six of the portfolio holdings ranked in the Top Ten.
| Ticker | Account Value |
| ADP | 3,167.36 |
| BDX | 3,175.28 |
| HTO | 4,016.15 |
| PEP | 3,666.89 |
| PPG | 3,521.10 |
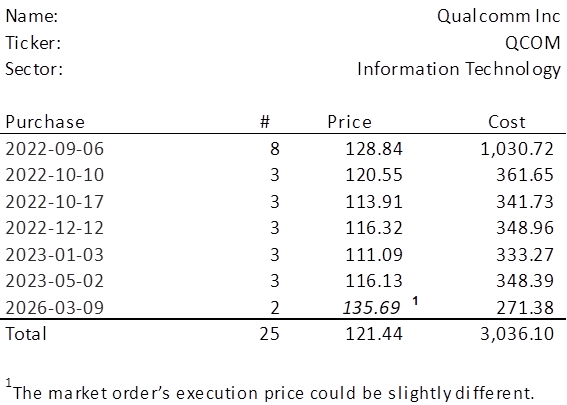
| QCOM | 3,120.87 |
The lowest amount belongs to QCOM which last traded at $135.69. I will acquire 2 shares on Monday morning. Below, is the purchase history and average cost calculation.
It has been nearly three years since we last added to our position in QCOM. And really, it has been in the Top Ten on many occasions since then, it’s just that there has always been at least one position in greater need. Let’s see how they have been performing over the past three years and place that performance into the context of the last 17+ years.
Observations
Stock Price
Believe it or not, QCOM reached an all-time high of $230.631 on 2024-06-18 and fell all the way down to $120.80 in the throes of Liberation Day less than a year later. Since then, the stock has traded as high as $205 for the briefest of moments and sits at $135.69 as of Friday’s close. Even up off of those lows in April 2025, it is surprising to see a 41% price drop for a company whose earnings are in a strong upward trend.
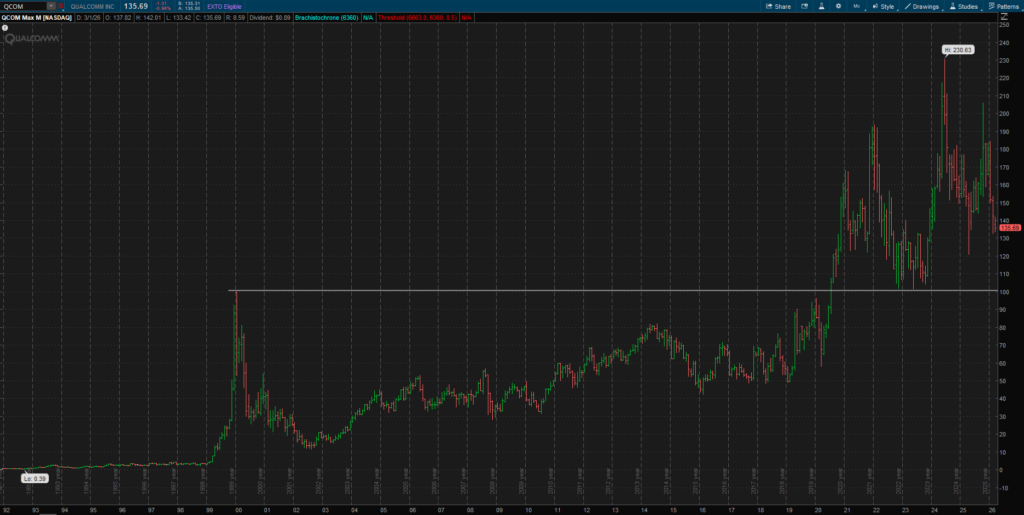
The daily chart from Charles Schwab’s thinkorswim trading platform draws attention to (1) the extreme price volatility in recent years and (2) the $100 support level touched in 2022 and 2023, first established at the start of 2000 as a stalagmite. This most recent price decent began on 2026-01-09 and seems to be getting a second wind with the war in Iran. If that war begins to show signs that it will outlast most of us, I would not be at all surprised if QCOM tests that $100 level a third time.
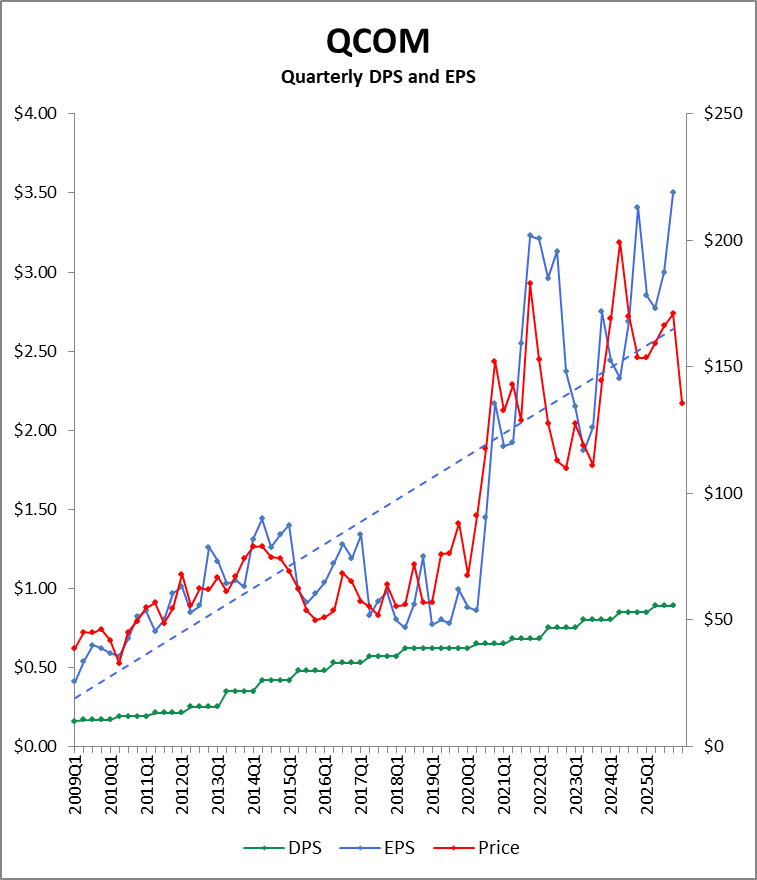
Of more importance, note that in the quarterly chart above, the stock price tracks quarterly EPS fairly well (albeit on different scales) except as of right now; there is an odd divergence happening as I type and that is precisely why QCOM finds itself in the Top Ten.
Earnings
Magnitude/Trend
Clearly, the quarterly earnings are in a strong, long-term, positive trend. The blue dotted line in the chart above actually does a poor job of delineating the overall earnings trend, largely due to a five-year span of flat to declining earnings in the middle of the chart. However, those days are behind QCOM. EPS exploded in 2022Q3 and with significant volatility the EPS has been very strong.
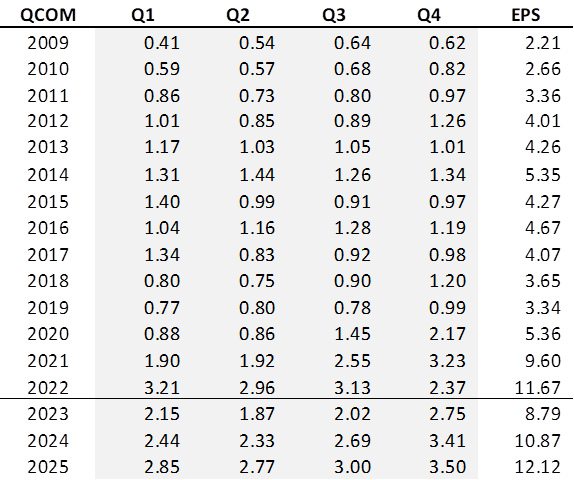
It took three years to surpass the former record high earnings of $11.67 in CY2022. In fact, 2025Q4 EPS of $3.50 set a new record for a quarter.
Seasonality
Typically, the quarterly distribution of annual earnings breaks down as follows: 24.2% in Q1, 22.3% in Q2, 24.8% in Q3, and 28.7% in Q4. The variation around these percentages is minimal and are reliable. The difference between the halves of the calendar year is a bit more pronounced with the first half typically coming in at 46.5% and the second half at 53.5%.
There have been 12 quarterly earnings reports since we last added to this position. In fact, those three calendar years represent the best three calendar years on a rolling 3-year basis.
Dividends
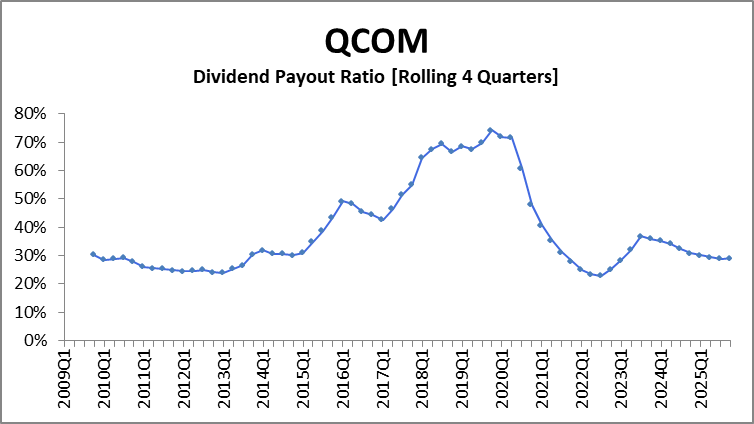
The technology sector has no Dividend Kings. However, it is highly likely that in two years, QCOM will be a Dividend Aristocrat with a 25-year dividend increase streak. The company’s dividend payout ratio has been steadily trending lower and now sits at a very comfortable 29%. The dividend yield is a respectable 2.6%.
Thoughts on Investment
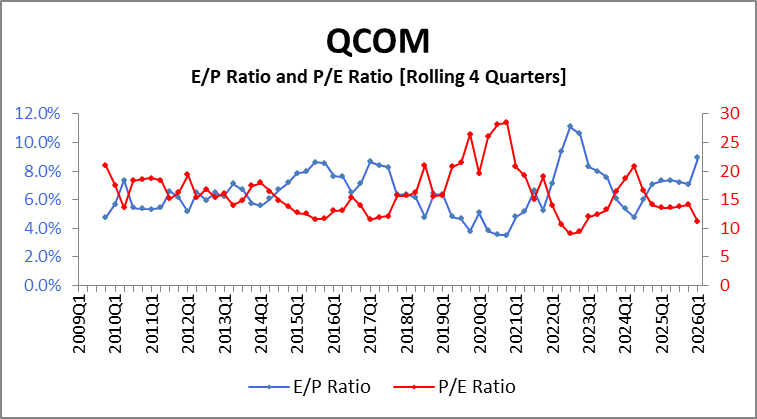
The trailing 12-month P/E ratio is currently 11.2, lower than the average for QCOM of 16.3 over the period above.
QCOM has lowered their EPS guidance for fiscal year 2026 (which is already one quarter complete) from $12.11 to $11.30. That would be a 6% decline from the previous fiscal year. The day that was announced, the share price gapped down about 8%. So FY2026 and similarly CY2026 likely won’t be a record setting year. But there is nothing to suggest QCOM won’t keep raising its dividend annually.
Further, CFRA, Sure Dividend, Morningstar, GuruFocus, and Simply Wall St., all place their fair value or 12-month target value higher than where it is currently trading, ranging from $145 to $181. So, let’s take some comfort in the collective analysis and evaluation by people who are right just as often as they are wrong and grab some shares without questioning their expertise. Royal Dividends says it is a great time to add to the QCOM position.
- This high is not seen in the very first chart presented because that chart only captures the price of each quarter’s close. ↩︎