
This week, six of the portfolio holdings ranked in the Top Ten.
| Ticker | Account Value |
| BDX | 3,549.96 |
| FMCB | 4,180.00 |
| HTO | 3,128.58 |
| PPG | 3,653.76 |
| QCOM | 3,722.09 |
| SCL | 2,982.82 |
The lowest amount belongs to SCL which last traded at $48.11. Therefore, I will acquire 6 shares on Monday. Below, is the purchase history and average cost calculation.
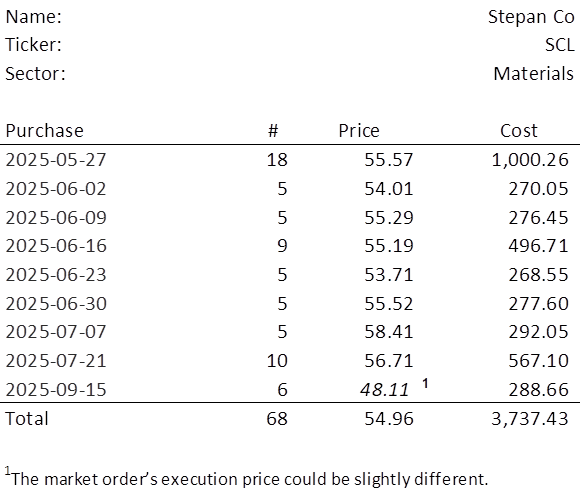
There has been a quarterly earnings announcement since the last time I put money into this sinking fund position; it’s a good time to assess its recent performance in the context of the last 16+ years.
Observations
Stock Price
SCL is in the midst of a multi-year price slide, now trading at just a third of its all-time high. It wasn’t always this way. I found myself asking where the stock might find price support, and the answer seems to be around $40.
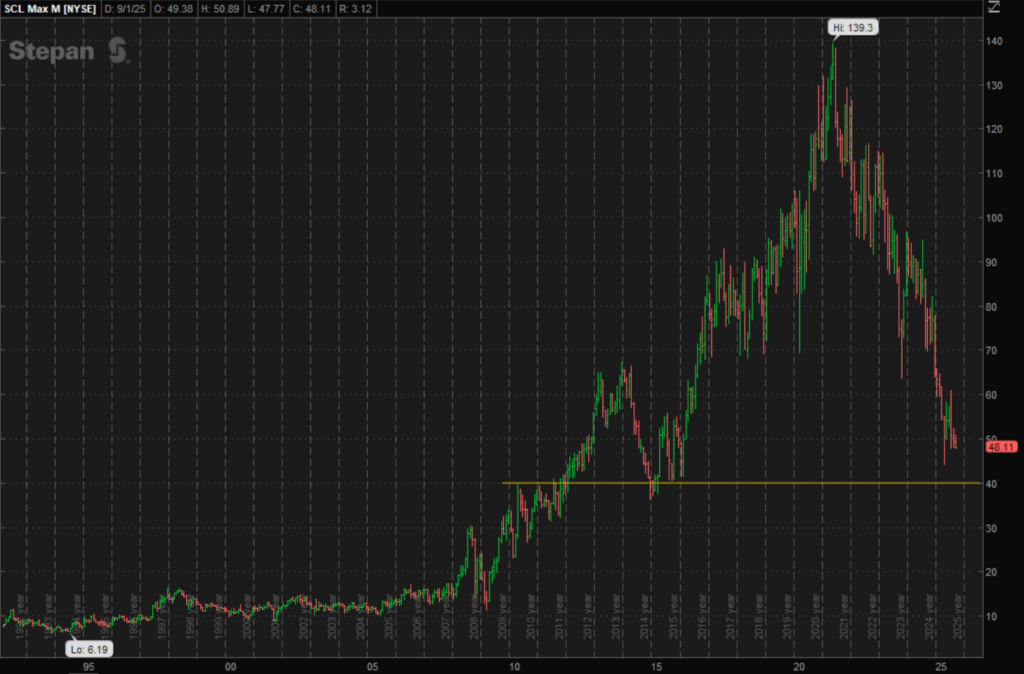
I’ve written before about these “magnetic” price levels—zones that the market gravitates toward, often set years ago and largely forgotten until prices revisit them. When they do, the reaction tends to be binary: either the valuation is seen as justified, or it’s dismissed as irrational. In the latter case, that price often becomes a springboard for recovery. For SCL, reaching $40 would likely reflect weak earnings in the second half of the year. Barring that, it shouldn’t fall that far.
Earnings
Magnitude/Trend
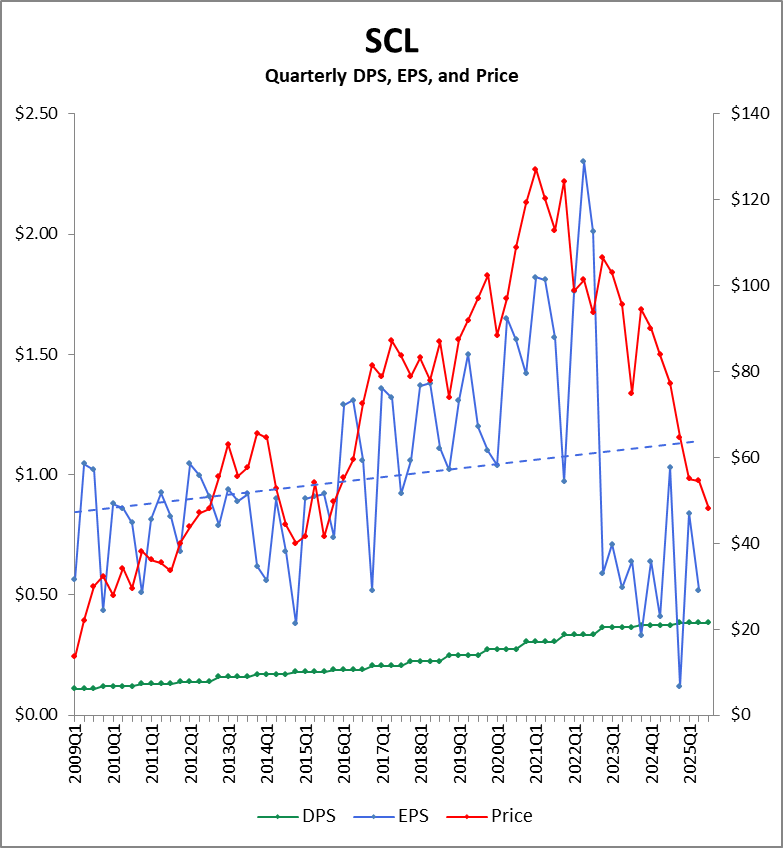
The chart makes it clear: earnings are the driving force behind SCL’s multi-year decline. While 2025Q2 EPS came in at $0.52—well below the $0.90 consensus estimate—it still marks a 26.8% improvement over the same quarter last year.
Now consider this sequence: +25, +10, -25, -55, -15, -11, +81, -39, +58, -65, +32, -42. These figures represent the percentage earnings surprises—beats and misses—over the past three years. The takeaway? Analysts have consistently misjudged both the direction and magnitude of SCL’s earnings. Forecasting has been erratic at best. In fact, management at SCL offers no earnings guidance whatsoever.
What truly matters is the trajectory of actual earnings. After a steep drop in late 2022, EPS now sits at roughly a third of its former peak. Still, I believe we’re seeing the early signs of a recovery. If this emerging upward trend in earnings continues through the second half of the year, the stock price is likely to follow.
Seasonality
Typically, the quarterly distribution of annual earnings breaks down as follows: 27% in Q1, 29% in Q2, 28% in Q3, and 17% in Q4. Given this breakdown, it’s useful to view earnings in two halves: 55% typically occurs in the first half of the year, and 45% in the second.
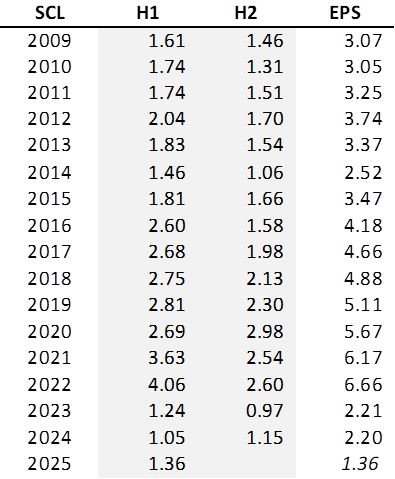
2025H1 EPS of $1.36 is up nearly 30% over last year and if it ends up being 55% of the calendar year, we should see 2025 EPS of perhaps $2.47. Trading at $48.11, that would be a P/E ratio just shy of 20. I do not expect much upward price movement until earnings start moving more – but a 30% move in the first half tells me we might be off the bottom now.
Dividends
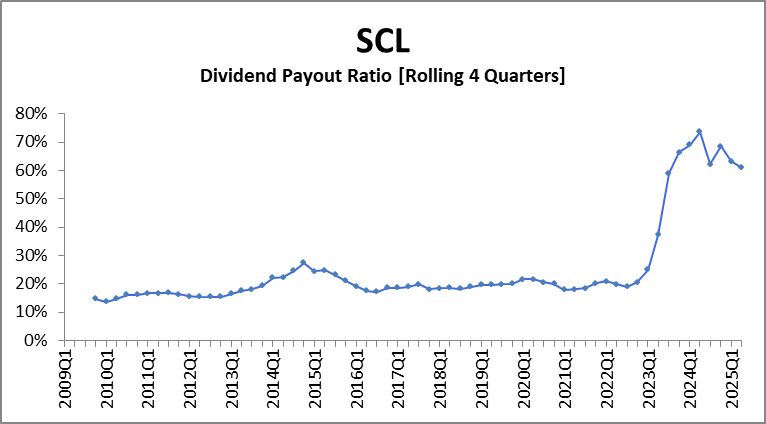
SCL is a Dividend King with a 57-year streak. Though the payout ratio has skyrocketed, and there have been two quarters in recent history where the quarterly dividend has exceeded the quarter’s earnings, dividends should be well covered for the foreseeable future with current payout levels under 70% of EPS.
Thoughts on Investment
This is not a case where the stock is trading at laughably low P/E ratio levels; SCL is trading at a decent trailing P/E ratio of 19.2. This is about being at the cyclical low point for earnings. Selling raw materials like surfactants and polymers, SCL is beholden to the world’s manufacturers and there has been economic weakness not only in the United States but abroad.
It will take time for SCL’s stock price to gain some traction, and it may not happen until annual earnings climb back above $3. Until then, we’ll continue to nibble on SCL, perhaps even averaging down a bit along the way. If the position grows to 100 shares, SCL would be a good candidate for writing covered calls and increasing our income from the position.